Capital One 2015 Annual Report Download - page 159
Download and view the complete annual report
Please find page 159 of the 2015 Capital One annual report below. You can navigate through the pages in the report by either clicking on the pages listed below, or by using the keyword search tool below to find specific information within the annual report.-
 1
1 -
2
-
3
-
4
-
5
-
6
-
7
-
8
-
9
-
10
-
11
-
12
-
13
-
14
-
15
-
16
-
17
-
18
-
19
-
20
-
21
-
22
-
23
-
24
-
25
-
26
-
27
-
28
-
29
-
30
-
31
-
32
-
33
-
34
-
35
-
36
-
37
-
38
-
39
-
40
-
41
-
42
-
43
-
44
-
45
-
46
-
47
-
48
-
49
-
50
-
51
-
52
-
53
-
54
-
55
-
56
-
57
-
58
-
59
-
60
-
61
-
62
-
63
-
64
-
65
-
66
-
67
-
68
-
69
-
70
-
71
-
72
-
73
-
74
-
75
-
76
-
77
-
78
-
79
-
80
-
81
-
82
-
83
-
84
-
85
-
86
-
87
-
88
-
89
-
90
-
91
-
92
-
93
-
94
-
95
-
96
-
97
-
98
-
99
-
100
-
101
-
102
-
103
-
104
-
105
-
106
-
107
-
108
-
109
-
110
-
111
-
112
-
113
-
114
-
115
-
116
-
117
-
118
-
119
-
120
-
121
-
122
-
123
-
124
-
125
-
126
-
127
-
128
-
129
-
130
-
131
-
132
-
133
-
134
-
135
-
136
-
137
-
138
-
139
-
140
-
141
-
142
-
143
-
144
-
145
-
146
-
147
-
148
-
 149
149 -
 150
150 -
 151
151 -
 152
152 -
 153
153 -
 154
154 -
 155
155 -
 156
156 -
 157
157 -
 158
158 -
 159
159 -
 160
160 -
 161
161 -
 162
162 -
 163
163 -
 164
164 -
 165
165 -
 166
166 -
 167
167 -
 168
168 -
 169
169 -
170
-
171
-
172
-
173
-
174
-
175
-
176
-
177
-
178
-
179
-
180
-
181
-
182
-
183
-
184
-
185
-
186
-
187
-
188
-
189
-
190
-
191
-
192
-
193
-
194
-
195
-
196
-
197
-
198
-
199
-
200
-
201
-
202
-
203
-
204
-
205
-
206
-
207
-
208
-
209
-
210
-
211
-
212
-
213
-
214
-
215
-
216
-
217
-
218
-
219
-
220
-
221
-
222
-
223
-
224
-
225
-
226
-
227
-
228
-
229
-
230
-
231
-
232
-
233
-
234
-
235
-
236
-
237
-
238
-
239
-
240
-
241
-
242
-
243
-
244
-
245
-
246
-
247
-
248
-
249
-
250
-
251
-
252
-
253
 |
 |

CAPITAL ONE FINANCIAL CORPORATION
NOTES TO CONSOLIDATED FINANCIAL STATEMENTS
140 Capital One Financial Corporation (COF)
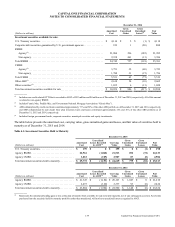
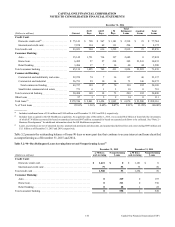
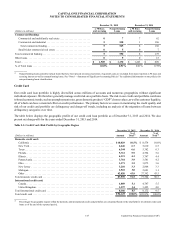
Investment Securities in a Gross Unrealized Loss Position
The table below provides, by major security type, information about our securities available for sale in a gross unrealized loss
position and the length of time that individual securities have been in a continuous unrealized loss position as of December 31,
2015 and 2014.
Table 4.4: Securities in an Unrealized Loss Position
December 31, 2015
Less than 12 Months 12 Months or Longer Total
(Dollars in millions) Fair Value
Gross
Unrealized
Losses Fair Value
Gross
Unrealized
Losses Fair Value
Gross
Unrealized
Losses
Investment securities available for sale:
U.S. Treasury securities. . . . . . . . . . . . . . . . . . . . . . . . . . . . . . $ 3,096 $ (9) $ 1 $ 0 $ 3,097 $ (9)
RMBS:
Agency . . . . . . . . . . . . . . . . . . . . . . . . . . . . . . . . . . . . . . . . 12,025 (110) 4,420 (102) 16,445 (212)
Non-agency . . . . . . . . . . . . . . . . . . . . . . . . . . . . . . . . . . . . 355 (10) 155 (12) 510 (22)
Total RMBS. . . . . . . . . . . . . . . . . . . . . . . . . . . . . . . . . . . . . . . 12,380 (120) 4,575 (114) 16,955 (234)
CMBS:
Agency . . . . . . . . . . . . . . . . . . . . . . . . . . . . . . . . . . . . . . . . 1,352 (9) 1,148 (38) 2,500 (47)
Non-agency . . . . . . . . . . . . . . . . . . . . . . . . . . . . . . . . . . . . 739 (13) 330 (11) 1,069 (24)
Total CMBS. . . . . . . . . . . . . . . . . . . . . . . . . . . . . . . . . . . . . . . 2,091 (22) 1,478 (49) 3,569 (71)
Other ABS. . . . . . . . . . . . . . . . . . . . . . . . . . . . . . . . . . . . . . . . 825 (5) 255 (1) 1,080 (6)
Other securities . . . . . . . . . . . . . . . . . . . . . . . . . . . . . . . . . . . . 250 0 19 (1) 269 (1)
Total investment securities available for sale in a gross
unrealized loss position . . . . . . . . . . . . . . . . . . . . . . . . . . . . . . $ 18,642 $ (156) $ 6,328 $ (165) $ 24,970 $ (321)
December 31, 2014
Less than 12 Months 12 Months or Longer Total
(Dollars in millions) Fair Value
Gross
Unrealized
Losses Fair Value
Gross
Unrealized
Losses Fair Value
Gross
Unrealized
Losses
Investment securities available for sale:
U.S. Treasury securities. . . . . . . . . . . . . . . . . . . . . . . . . . . . . . $ 1,499 $ (1) $ 0 $ 0 $ 1,499 $ (1)
Corporate debt securities guaranteed by U.S. government
agencies . . . . . . . . . . . . . . . . . . . . . . . . . . . . . . . . . . . . . . . . . . 113 (2) 557 (18) 670 (20)
RMBS:
Agency . . . . . . . . . . . . . . . . . . . . . . . . . . . . . . . . . . . . . . . . 3,917 (15) 4,413 (90) 8,330 (105)
Non-agency . . . . . . . . . . . . . . . . . . . . . . . . . . . . . . . . . . . . 412 (9) 90 (4) 502 (13)
Total RMBS. . . . . . . . . . . . . . . . . . . . . . . . . . . . . . . . . . . . . . . 4,329 (24) 4,503 (94) 8,832 (118)
CMBS:
Agency . . . . . . . . . . . . . . . . . . . . . . . . . . . . . . . . . . . . . . . . 294 (2) 1,993 (58) 2,287 (60)
Non-agency . . . . . . . . . . . . . . . . . . . . . . . . . . . . . . . . . . . . 258 (1) 681 (14) 939 (15)
Total CMBS. . . . . . . . . . . . . . . . . . . . . . . . . . . . . . . . . . . . . . . 552 (3) 2,674 (72) 3,226 (75)
Other ABS. . . . . . . . . . . . . . . . . . . . . . . . . . . . . . . . . . . . . . . . 783 (1) 586 (9) 1,369 (10)
Other securities . . . . . . . . . . . . . . . . . . . . . . . . . . . . . . . . . . . . 106 0 551 (13) 657 (13)
Total investment securities available for sale in a gross
unrealized loss position . . . . . . . . . . . . . . . . . . . . . . . . . . . . . . $ 7,382 $ (31) $ 8,871 $ (206) $ 16,253 $ (237)
As of December 31, 2015, the amortized cost of approximately 700 securities available for sale exceeded their fair value by $321
million, of which $165 million related to securities that had been in a loss position for 12 months or longer. As of December 31,