Capital One 2015 Annual Report Download - page 161
Download and view the complete annual report
Please find page 161 of the 2015 Capital One annual report below. You can navigate through the pages in the report by either clicking on the pages listed below, or by using the keyword search tool below to find specific information within the annual report.-
 1
1 -
2
-
3
-
4
-
5
-
6
-
7
-
8
-
9
-
10
-
11
-
12
-
13
-
14
-
15
-
16
-
17
-
18
-
19
-
20
-
21
-
22
-
23
-
24
-
25
-
26
-
27
-
28
-
29
-
30
-
31
-
32
-
33
-
34
-
35
-
36
-
37
-
38
-
39
-
40
-
41
-
42
-
43
-
44
-
45
-
46
-
47
-
48
-
49
-
50
-
51
-
52
-
53
-
54
-
55
-
56
-
57
-
58
-
59
-
60
-
61
-
62
-
63
-
64
-
65
-
66
-
67
-
68
-
69
-
70
-
71
-
72
-
73
-
74
-
75
-
76
-
77
-
78
-
79
-
80
-
81
-
82
-
83
-
84
-
85
-
86
-
87
-
88
-
89
-
90
-
91
-
92
-
93
-
94
-
95
-
96
-
97
-
98
-
99
-
100
-
101
-
102
-
103
-
104
-
105
-
106
-
107
-
108
-
109
-
110
-
111
-
112
-
113
-
114
-
115
-
116
-
117
-
118
-
119
-
120
-
121
-
122
-
123
-
124
-
125
-
126
-
127
-
128
-
129
-
130
-
131
-
132
-
133
-
134
-
135
-
136
-
137
-
138
-
139
-
140
-
141
-
142
-
143
-
144
-
145
-
146
-
147
-
148
-
149
-
150
-
 151
151 -
 152
152 -
 153
153 -
 154
154 -
 155
155 -
 156
156 -
 157
157 -
 158
158 -
 159
159 -
 160
160 -
 161
161 -
 162
162 -
 163
163 -
 164
164 -
 165
165 -
 166
166 -
 167
167 -
 168
168 -
 169
169 -
 170
170 -
 171
171 -
172
-
173
-
174
-
175
-
176
-
177
-
178
-
179
-
180
-
181
-
182
-
183
-
184
-
185
-
186
-
187
-
188
-
189
-
190
-
191
-
192
-
193
-
194
-
195
-
196
-
197
-
198
-
199
-
200
-
201
-
202
-
203
-
204
-
205
-
206
-
207
-
208
-
209
-
210
-
211
-
212
-
213
-
214
-
215
-
216
-
217
-
218
-
219
-
220
-
221
-
222
-
223
-
224
-
225
-
226
-
227
-
228
-
229
-
230
-
231
-
232
-
233
-
234
-
235
-
236
-
237
-
238
-
239
-
240
-
241
-
242
-
243
-
244
-
245
-
246
-
247
-
248
-
249
-
250
-
251
-
252
-
253
 |
 |

CAPITAL ONE FINANCIAL CORPORATION
NOTES TO CONSOLIDATED FINANCIAL STATEMENTS
142 Capital One Financial Corporation (COF)
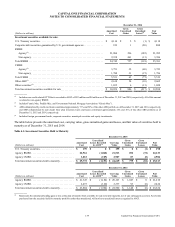
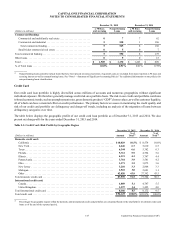
Table 4.7: Expected Maturities and Weighted-Average Yields of Securities
December 31, 2015
(Dollars in millions)
Due in
1 Year or
Less
Due > 1 Year
through
5 Years
Due > 5 Years
through
10 Years
Due > 10
Years Total
Fair value of securities available for sale:
U.S. Treasury securities. . . . . . . . . . . . . . . . . . . . . . . . . . . . . . . . . . . . $ 701 $ 3,958 $ 1 $ 0 $ 4,660
RMBS:
Agency . . . . . . . . . . . . . . . . . . . . . . . . . . . . . . . . . . . . . . . . . . . . . . 214 13,813 10,258 0 24,285
Non-agency . . . . . . . . . . . . . . . . . . . . . . . . . . . . . . . . . . . . . . . . . . 42 928 1,582 474 3,026
Total RMBS. . . . . . . . . . . . . . . . . . . . . . . . . . . . . . . . . . . . . . . . . . . . . 256 14,741 11,840 474 27,311
CMBS:
Agency . . . . . . . . . . . . . . . . . . . . . . . . . . . . . . . . . . . . . . . . . . . . . . 48 2,042 1,555 19 3,664
Non-agency . . . . . . . . . . . . . . . . . . . . . . . . . . . . . . . . . . . . . . . . . . 164 456 1,095 0 1,715
Total CMBS. . . . . . . . . . . . . . . . . . . . . . . . . . . . . . . . . . . . . . . . . . . . . 212 2,498 2,650 19 5,379
Other ABS . . . . . . . . . . . . . . . . . . . . . . . . . . . . . . . . . . . . . . . . . . . . . . 215 1,044 81 0 1,340
Other securities . . . . . . . . . . . . . . . . . . . . . . . . . . . . . . . . . . . . . . . . . . 263 5 0 103 371
Total securities available for sale. . . . . . . . . . . . . . . . . . . . . . . . . . . . . $ 1,647 $ 22,246 $ 14,572 $ 596 $ 39,061
Amortized cost of securities available for sale . . . . . . . . . . . . . . . . $ 1,651 $ 22,169 $ 14,444 $ 540 $ 38,804
Weighted-average yield for securities available for sale(1) . . . . . . . 0.80% 1.92% 3.01% 8.82% 2.37%
Carrying value of securities held to maturity:
U.S. Treasury securities. . . . . . . . . . . . . . . . . . . . . . . . . . . . . . . . . . . . $ 0 $ 199 $ 0 $ 0 $ 199
Agency RMBS. . . . . . . . . . . . . . . . . . . . . . . . . . . . . . . . . . . . . . . . . . . 10 1,336 16,697 3,470 21,513
Agency CMBS. . . . . . . . . . . . . . . . . . . . . . . . . . . . . . . . . . . . . . . . . . . 0 134 2,387 386 2,907
Total securities held to maturity . . . . . . . . . . . . . . . . . . . . . . . . . . . . . $ 10 $ 1,669 $ 19,084 $ 3,856 $ 24,619
Fair value of securities held to maturity . . . . . . . . . . . . . . . . . . . . . $ 10 $ 1,689 $ 19,707 $ 3,911 $ 25,317
Weighted-average yield for securities held to maturity(1) . . . . . . . 5.73% 2.77% 2.48% 3.29% 2.62%
__________
(1) The weighted-average yield represents the effective yield for the investment securities and is calculated based on the amortized cost of each security.
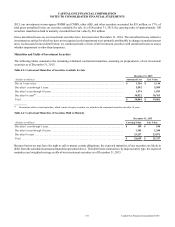
Other-Than-Temporary Impairment
We evaluate all securities in an unrealized loss position at least on a quarterly basis, and more often as market conditions require,
to assess whether the impairment is other-than-temporary. Our OTTI assessment is based on a discounted cash flow analysis which
requires careful use of judgments and assumptions. A number of qualitative and quantitative criteria may be considered in our
assessment as applicable, including the size and the nature of the portfolio; historical and projected performance such as prepayment,
default and loss severity for the RMBS portfolio; recent credit events specific to the issuer and/or industry to which the issuer
belongs; the payment structure of the security; external credit ratings of the issuer and any failure or delay of the issuer to make
scheduled interest or principal payments; the value of underlying collateral; our intent and ability to hold the security; and current
and projected market and macro-economic conditions.
If we intend to sell a security in an unrealized loss position or it is more likely than not that we will be required to sell the security
prior to recovery of its amortized cost basis, the entire difference between the amortized cost basis of the security and its fair value
is recognized in earnings. As of December 31, 2015, for any securities with unrealized losses recorded in AOCI, we do not intend
to sell nor believe that we will be required to sell these securities prior to recovery of their amortized cost.
For those securities that we do not intend to sell nor expect to be required to sell, an analysis is performed to determine if any of
the impairment is due to credit-related factors or whether it is due to other factors, such as interest rates. Credit-related impairment
is recognized in earnings, with the remaining unrealized non-credit-related impairment recorded in AOCI. We determine the credit