Capital One 2015 Annual Report Download - page 158
Download and view the complete annual report
Please find page 158 of the 2015 Capital One annual report below. You can navigate through the pages in the report by either clicking on the pages listed below, or by using the keyword search tool below to find specific information within the annual report.-
 1
1 -
2
-
3
-
4
-
5
-
6
-
7
-
8
-
9
-
10
-
11
-
12
-
13
-
14
-
15
-
16
-
17
-
18
-
19
-
20
-
21
-
22
-
23
-
24
-
25
-
26
-
27
-
28
-
29
-
30
-
31
-
32
-
33
-
34
-
35
-
36
-
37
-
38
-
39
-
40
-
41
-
42
-
43
-
44
-
45
-
46
-
47
-
48
-
49
-
50
-
51
-
52
-
53
-
54
-
55
-
56
-
57
-
58
-
59
-
60
-
61
-
62
-
63
-
64
-
65
-
66
-
67
-
68
-
69
-
70
-
71
-
72
-
73
-
74
-
75
-
76
-
77
-
78
-
79
-
80
-
81
-
82
-
83
-
84
-
85
-
86
-
87
-
88
-
89
-
90
-
91
-
92
-
93
-
94
-
95
-
96
-
97
-
98
-
99
-
100
-
101
-
102
-
103
-
104
-
105
-
106
-
107
-
108
-
109
-
110
-
111
-
112
-
113
-
114
-
115
-
116
-
117
-
118
-
119
-
120
-
121
-
122
-
123
-
124
-
125
-
126
-
127
-
128
-
129
-
130
-
131
-
132
-
133
-
134
-
135
-
136
-
137
-
138
-
139
-
140
-
141
-
142
-
143
-
144
-
145
-
146
-
147
-
 148
148 -
 149
149 -
 150
150 -
 151
151 -
 152
152 -
 153
153 -
 154
154 -
 155
155 -
 156
156 -
 157
157 -
 158
158 -
 159
159 -
 160
160 -
 161
161 -
 162
162 -
 163
163 -
 164
164 -
 165
165 -
 166
166 -
 167
167 -
 168
168 -
169
-
170
-
171
-
172
-
173
-
174
-
175
-
176
-
177
-
178
-
179
-
180
-
181
-
182
-
183
-
184
-
185
-
186
-
187
-
188
-
189
-
190
-
191
-
192
-
193
-
194
-
195
-
196
-
197
-
198
-
199
-
200
-
201
-
202
-
203
-
204
-
205
-
206
-
207
-
208
-
209
-
210
-
211
-
212
-
213
-
214
-
215
-
216
-
217
-
218
-
219
-
220
-
221
-
222
-
223
-
224
-
225
-
226
-
227
-
228
-
229
-
230
-
231
-
232
-
233
-
234
-
235
-
236
-
237
-
238
-
239
-
240
-
241
-
242
-
243
-
244
-
245
-
246
-
247
-
248
-
249
-
250
-
251
-
252
-
253
 |
 |

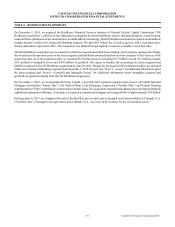
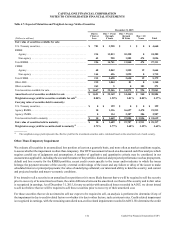
CAPITAL ONE FINANCIAL CORPORATION
NOTES TO CONSOLIDATED FINANCIAL STATEMENTS
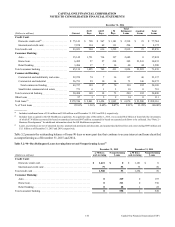
139 Capital One Financial Corporation (COF)
December 31, 2014
(Dollars in millions)
Amortized
Cost
Gross
Unrealized
Gains
Gross
Unrealized
Losses(1) Fair
Value
Investment securities available for sale:
U.S. Treasury securities . . . . . . . . . . . . . . . . . . . . . . . . . . . . . . . . . . . . . . . . . . . . . . . . . $ 4,114 $ 5 $ (1) $ 4,118
Corporate debt securities guaranteed by U.S. government agencies . . . . . . . . . . . . . . . 819 1 (20) 800
RMBS:
Agency(2) . . . . . . . . . . . . . . . . . . . . . . . . . . . . . . . . . . . . . . . . . . . . . . . . . . . . . . . . . . 21,804 296 (105) 21,995
Non-agency . . . . . . . . . . . . . . . . . . . . . . . . . . . . . . . . . . . . . . . . . . . . . . . . . . . . . . . . 2,938 461 (13) 3,386
Total RMBS . . . . . . . . . . . . . . . . . . . . . . . . . . . . . . . . . . . . . . . . . . . . . . . . . . . . . . . . . . 24,742 757 (118) 25,381
CMBS:
Agency(2) . . . . . . . . . . . . . . . . . . . . . . . . . . . . . . . . . . . . . . . . . . . . . . . . . . . . . . . . . . 3,751 32 (60) 3,723
Non-agency . . . . . . . . . . . . . . . . . . . . . . . . . . . . . . . . . . . . . . . . . . . . . . . . . . . . . . . . 1,780 31 (15) 1,796
Total CMBS . . . . . . . . . . . . . . . . . . . . . . . . . . . . . . . . . . . . . . . . . . . . . . . . . . . . . . . . . . 5,531 63 (75) 5,519
Other ABS(3) . . . . . . . . . . . . . . . . . . . . . . . . . . . . . . . . . . . . . . . . . . . . . . . . . . . . . . . . . . 2,618 54 (10) 2,662
Other securities(4) . . . . . . . . . . . . . . . . . . . . . . . . . . . . . . . . . . . . . . . . . . . . . . . . . . . . . . 1,035 6 (13) 1,028
Total investment securities available for sale. . . . . . . . . . . . . . . . . . . . . . . . . . . . . . . . . $ 38,859 $ 886 $ (237) $ 39,508
__________
(1) Includes non-credit-related OTTI that is recorded in AOCI of $22 million and $8 million as of December 31, 2015 and 2014, respectively. All of this amount
is related to non-agency RMBS.
(2) Includes Fannie Mae, Freddie Mac, and Government National Mortgage Association (“Ginnie Mae”).
(3) ABS collateralized by credit card loans constituted approximately 71% and 56% of the other ABS portfolio as of December 31, 2015 and 2014, respectively,
and ABS collateralized by auto dealer floor plan inventory loans and leases constituted approximately 11% and 16% of the other ABS portfolio as of
December 31, 2015 and 2014, respectively.
(4) Includes foreign government bonds, corporate securities, municipal securities and equity investments.
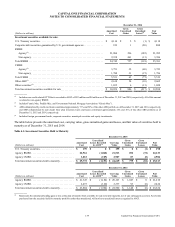
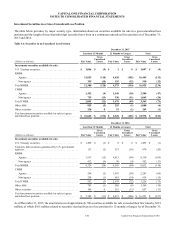
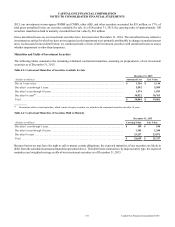
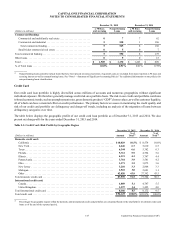
The table below presents the amortized cost, carrying value, gross unrealized gains and losses, and fair value of securities held to
maturity as of December 31, 2015 and 2014.
Table 4.3: Investment Securities Held to Maturity
December 31, 2015
(Dollars in millions)
Amortized
Cost
Unrealized
Losses Recorded
in AOCI(1) Carrying
Value
Gross
Unrealized
Gains
Gross
Unrealized
Losses
Fair
Value
U.S. Treasury securities . . . . . . . . . . . . . . . . . . . . . . . . . . $ 199 $ 0 $ 199 $ 0 $ (1) $ 198
Agency RMBS . . . . . . . . . . . . . . . . . . . . . . . . . . . . . . . . . 22,561 (1,048) 21,513 692 (72) 22,133
Agency CMBS . . . . . . . . . . . . . . . . . . . . . . . . . . . . . . . . . 3,012 (105) 2,907 87 (8) 2,986
Total investment securities held to maturity. . . . . . . . . . . $ 25,772 $ (1,153) $ 24,619 $ 779 $ (81) $ 25,317
December 31, 2014
(Dollars in millions)
Amortized
Cost
Unrealized
Losses Recorded
in AOCI(1) Carrying
Value
Gross
Unrealized
Gains
Gross
Unrealized
Losses
Fair
Value
Agency RMBS . . . . . . . . . . . . . . . . . . . . . . . . . . . . . . . . . $ 21,347 $ (1,184) $ 20,163 $ 1,047 $ 0 $ 21,210
Agency CMBS . . . . . . . . . . . . . . . . . . . . . . . . . . . . . . . . . 2,457 (120) 2,337 93 (6) 2,424
Total investment securities held to maturity. . . . . . . . . . . $ 23,804 $ (1,304) $ 22,500 $ 1,140 $ (6) $ 23,634
__________
(1) Represents the unrealized holding gain or loss at the date of transfer from available for sale to held to maturity, net of any subsequent accretion. Any bonds
purchased into the securities held for maturity portfolio rather than transferred, will not have unrealized losses recognized in AOCI.