Capital One 2015 Annual Report Download - page 81
Download and view the complete annual report
Please find page 81 of the 2015 Capital One annual report below. You can navigate through the pages in the report by either clicking on the pages listed below, or by using the keyword search tool below to find specific information within the annual report.-
 1
1 -
2
-
3
-
4
-
5
-
6
-
7
-
8
-
9
-
10
-
11
-
12
-
13
-
14
-
15
-
16
-
17
-
18
-
19
-
20
-
21
-
22
-
23
-
24
-
25
-
26
-
27
-
28
-
29
-
30
-
31
-
32
-
33
-
34
-
35
-
36
-
37
-
38
-
39
-
40
-
41
-
42
-
43
-
44
-
45
-
46
-
47
-
48
-
49
-
50
-
51
-
52
-
53
-
54
-
55
-
56
-
57
-
58
-
59
-
60
-
61
-
62
-
63
-
64
-
65
-
66
-
67
-
68
-
69
-
70
-
 71
71 -
 72
72 -
 73
73 -
 74
74 -
 75
75 -
 76
76 -
 77
77 -
 78
78 -
 79
79 -
 80
80 -
 81
81 -
 82
82 -
 83
83 -
 84
84 -
 85
85 -
 86
86 -
 87
87 -
 88
88 -
 89
89 -
 90
90 -
 91
91 -
92
-
93
-
94
-
95
-
96
-
97
-
98
-
99
-
100
-
101
-
102
-
103
-
104
-
105
-
106
-
107
-
108
-
109
-
110
-
111
-
112
-
113
-
114
-
115
-
116
-
117
-
118
-
119
-
120
-
121
-
122
-
123
-
124
-
125
-
126
-
127
-
128
-
129
-
130
-
131
-
132
-
133
-
134
-
135
-
136
-
137
-
138
-
139
-
140
-
141
-
142
-
143
-
144
-
145
-
146
-
147
-
148
-
149
-
150
-
151
-
152
-
153
-
154
-
155
-
156
-
157
-
158
-
159
-
160
-
161
-
162
-
163
-
164
-
165
-
166
-
167
-
168
-
169
-
170
-
171
-
172
-
173
-
174
-
175
-
176
-
177
-
178
-
179
-
180
-
181
-
182
-
183
-
184
-
185
-
186
-
187
-
188
-
189
-
190
-
191
-
192
-
193
-
194
-
195
-
196
-
197
-
198
-
199
-
200
-
201
-
202
-
203
-
204
-
205
-
206
-
207
-
208
-
209
-
210
-
211
-
212
-
213
-
214
-
215
-
216
-
217
-
218
-
219
-
220
-
221
-
222
-
223
-
224
-
225
-
226
-
227
-
228
-
229
-
230
-
231
-
232
-
233
-
234
-
235
-
236
-
237
-
238
-
239
-
240
-
241
-
242
-
243
-
244
-
245
-
246
-
247
-
248
-
249
-
250
-
251
-
252
-
253
 |
 |

62 Capital One Financial Corporation (COF)
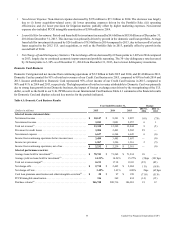
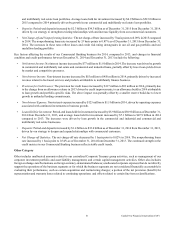
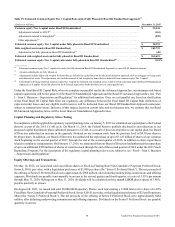
Table 9 summarizes the financial results of our Other category for the periods indicated.
Table 9: Other Category Results
Year Ended December 31, Change
(Dollars in millions) 2015 2014 2013 2015 vs.
2014
2014 vs.
2013
Selected income statement data:
Net interest income (expense). . . . . . . . . . . . . . . . . . . . . . . . . . . . . . . . $ 53 $ 9 $ (440) ** **
Non-interest income . . . . . . . . . . . . . . . . . . . . . . . . . . . . . . . . . . . . . . . (39) 27 (186) ** **
Total net revenue (loss)(1) . . . . . . . . . . . . . . . . . . . . . . . . . . . . . . . . . . . 14 36 (626) (61)% **
Benefit for credit losses. . . . . . . . . . . . . . . . . . . . . . . . . . . . . . . . . . . . . (2) (5) (3) (60) 67%
Non-interest expense. . . . . . . . . . . . . . . . . . . . . . . . . . . . . . . . . . . . . . . 312 165 211 89 (22)
Loss from continuing operations before income taxes . . . . . . . . . . . . . (296) (124) (834) 139 (85)
Income tax benefit. . . . . . . . . . . . . . . . . . . . . . . . . . . . . . . . . . . . . . . . . (350) (214) (391) 64 (45)
Income (loss) from continuing operations, net of tax . . . . . . . . . . . . . . $ 54 $ 90 $ (443) (40) **
__________
** Change is not meaningful.
(1) Some of our tax-related commercial investments generate tax-exempt income or tax credits, accordingly we make certain reclassifications within our
Commercial Banking business results to present revenues and yields on a taxable-equivalent basis, calculated assuming an effective tax rate approximately
equal to our federal statutory tax rate of 35%, with offsetting reclassifications within the Other category.
Net income from continuing operations recorded in the Other category was $54 million in 2015, compared to $90 million in 2014.
The reduction in net income in 2015 was primarily due to charges associated with (i) severance and related benefits pursuant to
our ongoing benefit program as a result of the realignment of our workforce; and (ii) certain planned site closures, partially offset
by higher discrete tax benefits and net tax credits.
Net income from continuing operations recorded in the Other category was $90 million in 2014, compared to a net loss from
continuing operations of $443 million in 2013. The shift to a net profit from a net loss was primarily due to lower funding costs,
as well as the absence of the one-time charge associated with our redemption of trust preferred securities in January 2013.
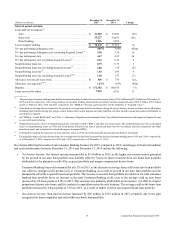
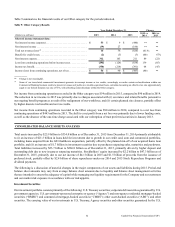
CONSOLIDATED BALANCE SHEETS ANALYSIS
Total assets increased by $25.9 billion to $334.0 billion as of December 31, 2015 from December 31, 2014 primarily attributable
to (i) an increase of $21.5 billion in loans held for investment due to growth in our credit card, auto and commercial portfolios,
including loans acquired from the GE Healthcare acquisition, partially offset by the planned run-off of our acquired home loan
portfolio; and (ii) an increase of $1.7 billion in investment securities due to purchases outpacing sales, maturities and paydowns.
Total liabilities increased by $23.7 billion to $286.8 billion as of December 31, 2015, primarily driven by higher deposit and
outstanding debt due to new issuances outpacing maturities. Stockholders’ equity increased by $2.2 billion to $47.3 billion as of
December 31, 2015, primarily due to our net income of $4.1 billion in 2015 and $1.5 billion of proceeds from the issuance of
preferred stock, partially offset by $2.4 billion of share repurchases under our 2014 and 2015 Stock Repurchase Programs and
dividend payments.
The following is a discussion of material changes in the major components of our assets and liabilities during 2015. Period-end
balance sheet amounts may vary from average balance sheet amounts due to liquidity and balance sheet management activities
that are intended to ensure the adequacy of capital while managing our liquidity requirements for the Company and our customers
and our market risk exposure in accordance with our risk appetite.
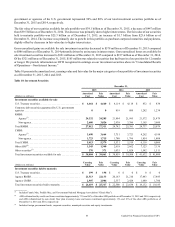
Investment Securities
Our investment portfolio consists primarily of the following: U.S. Treasury securities; corporate debt securities guaranteed by U.S.
government agencies; U.S. government-sponsored enterprise or agency (“Agency”) and non-agency residential mortgage-backed
securities (“RMBS”) and commercial mortgage-backed securities (“CMBS”); other asset-backed securities (“ABS”); and other
securities. The carrying value of our investments in U.S. Treasury, Agency securities and other securities guaranteed by the U.S.