Capital One 2015 Annual Report Download - page 195
Download and view the complete annual report
Please find page 195 of the 2015 Capital One annual report below. You can navigate through the pages in the report by either clicking on the pages listed below, or by using the keyword search tool below to find specific information within the annual report.-
 1
1 -
2
-
3
-
4
-
5
-
6
-
7
-
8
-
9
-
10
-
11
-
12
-
13
-
14
-
15
-
16
-
17
-
18
-
19
-
20
-
21
-
22
-
23
-
24
-
25
-
26
-
27
-
28
-
29
-
30
-
31
-
32
-
33
-
34
-
35
-
36
-
37
-
38
-
39
-
40
-
41
-
42
-
43
-
44
-
45
-
46
-
47
-
48
-
49
-
50
-
51
-
52
-
53
-
54
-
55
-
56
-
57
-
58
-
59
-
60
-
61
-
62
-
63
-
64
-
65
-
66
-
67
-
68
-
69
-
70
-
71
-
72
-
73
-
74
-
75
-
76
-
77
-
78
-
79
-
80
-
81
-
82
-
83
-
84
-
85
-
86
-
87
-
88
-
89
-
90
-
91
-
92
-
93
-
94
-
95
-
96
-
97
-
98
-
99
-
100
-
101
-
102
-
103
-
104
-
105
-
106
-
107
-
108
-
109
-
110
-
111
-
112
-
113
-
114
-
115
-
116
-
117
-
118
-
119
-
120
-
121
-
122
-
123
-
124
-
125
-
126
-
127
-
128
-
129
-
130
-
131
-
132
-
133
-
134
-
135
-
136
-
137
-
138
-
139
-
140
-
141
-
142
-
143
-
144
-
145
-
146
-
147
-
148
-
149
-
150
-
151
-
152
-
153
-
154
-
155
-
156
-
157
-
158
-
159
-
160
-
161
-
162
-
163
-
164
-
165
-
166
-
167
-
168
-
169
-
170
-
171
-
172
-
173
-
174
-
175
-
176
-
177
-
178
-
179
-
180
-
181
-
182
-
183
-
184
-
 185
185 -
 186
186 -
 187
187 -
 188
188 -
 189
189 -
 190
190 -
 191
191 -
 192
192 -
 193
193 -
 194
194 -
 195
195 -
 196
196 -
 197
197 -
 198
198 -
 199
199 -
 200
200 -
 201
201 -
 202
202 -
 203
203 -
 204
204 -
 205
205 -
206
-
207
-
208
-
209
-
210
-
211
-
212
-
213
-
214
-
215
-
216
-
217
-
218
-
219
-
220
-
221
-
222
-
223
-
224
-
225
-
226
-
227
-
228
-
229
-
230
-
231
-
232
-
233
-
234
-
235
-
236
-
237
-
238
-
239
-
240
-
241
-
242
-
243
-
244
-
245
-
246
-
247
-
248
-
249
-
250
-
251
-
252
-
253
 |
 |

CAPITAL ONE FINANCIAL CORPORATION
NOTES TO CONSOLIDATED FINANCIAL STATEMENTS
176 Capital One Financial Corporation (COF)
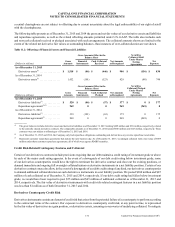
a central clearinghouse are not subject to offsetting due to current uncertainty about the legal enforceability of our right of setoff
with the clearinghouses.
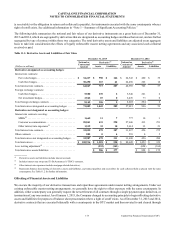
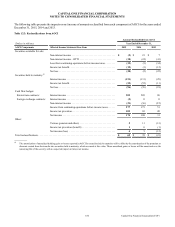
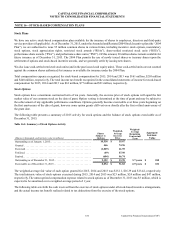
The following table presents as of December 31, 2015 and 2014 the gross and net fair values of our derivative assets and liabilities
and repurchase agreements, as well as the related offsetting amounts permitted under U.S. GAAP. The table also includes cash
and non-cash collateral received or pledged associated with such arrangements. The collateral amounts shown are limited to the
extent of the related net derivative fair values or outstanding balances, thus instances of over-collateralization are not shown.
Table 11.2: Offsetting of Financial Assets and Financial Liabilities
Gross
Amounts
Gross Amounts Offset in the
Balance Sheet
Net Amounts
as Recognized
Securities
Collateral Held
Under Master
Netting
Agreements
(Dollars in millions)
Financial
Instruments
Cash Collateral
Received
Net
Exposure
As of December 31, 2015
Derivatives assets(1) . . . . . . . . . . . . . . . . $ 1,518 $ (86) $ (446) $ 986 $ (156) $ 830
As of December 31, 2014
Derivatives assets(1) . . . . . . . . . . . . . . . . 1,452 (101) (523) 828 (80) 748
Gross
Amounts
Gross Amounts Offset in the
Balance Sheet
Net Amounts
as Recognized
Securities
Collateral Pledged
Under Master
Netting
Agreements
(Dollars in millions)
Financial
Instruments
Cash Collateral
Pledged
Net
Exposure
As of December 31, 2015
Derivatives liabilities(1). . . . . . . . . . . . . . $ 520 $ (86) $ (57) $ 377 $ 0 $ 377
Repurchase agreements(2)(3) . . . . . . . . . . 969 0 0 969 (969) 0
As of December 31, 2014
Derivatives liabilities(1). . . . . . . . . . . . . . 339 (101) (63) 175 0 175
Repurchase agreements(2) . . . . . . . . . . . . 869 0 0 869 (869) 0
__________
(1) The gross balances include derivative assets and derivative liabilities as of December 31, 2015 totaling $429 million and $314 million, respectively, related
to the centrally cleared derivative contracts. The comparable amounts as of December 31, 2014 totaled $360 million and $127 million, respectively. These
contracts were not subject to offsetting as of December 31, 2015 and 2014.
(2) As of December 31, 2015 and 2014, the Company only had repurchase obligations outstanding and did not have any reverse repurchase receivables.
(3) Represents customer repurchase agreements that mature the next business day. As of December 31, 2015, we pledged collateral with a fair value of $989
million under these customer repurchase agreements, all of which were agency RMBS securities.
Credit Risk-Related Contingency Features and Collateral
Certain of our derivatives contracts include provisions requiring that our debt maintain a credit rating of investment grade or above
by each of the major credit rating agencies. In the event of a downgrade of our debt credit rating below investment grade, some
of our derivatives counterparties would have the right to terminate the derivative contract and close out the existing positions, or
demand immediate and ongoing full overnight collateralization on derivative instruments in a net liability position. Certain of our
derivatives contracts may also allow, in the event of a downgrade of our debt credit rating of any kind, our derivatives counterparties
to demand additional collateralization on such derivatives instruments in a net liability position. We posted $304 million and $87
million of cash collateral as of December 31, 2015 and 2014, respectively. If our debt credit rating had fallen below investment
grade, we would have been required to post $55 million and $65 million of additional collateral as of December 31, 2015 and
2014, respectively. The fair value of derivatives instruments with credit risk-related contingent features in a net liability position
was less than $1 million as of both December 31, 2015 and 2014.
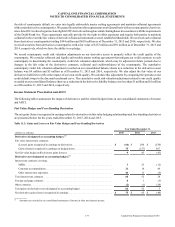
Derivatives Counterparty Credit Risk
Derivatives instruments contain an element of credit risk that arises from the potential failure of a counterparty to perform according
to the contractual terms of the contract. Our exposure to derivatives counterparty credit risk, at any point in time, is represented
by the fair value of derivatives in a gain position, or derivatives assets, assuming no recoveries of underlying collateral. To mitigate