Capital One 2015 Annual Report Download - page 171
Download and view the complete annual report
Please find page 171 of the 2015 Capital One annual report below. You can navigate through the pages in the report by either clicking on the pages listed below, or by using the keyword search tool below to find specific information within the annual report.-
 1
1 -
2
-
3
-
4
-
5
-
6
-
7
-
8
-
9
-
10
-
11
-
12
-
13
-
14
-
15
-
16
-
17
-
18
-
19
-
20
-
21
-
22
-
23
-
24
-
25
-
26
-
27
-
28
-
29
-
30
-
31
-
32
-
33
-
34
-
35
-
36
-
37
-
38
-
39
-
40
-
41
-
42
-
43
-
44
-
45
-
46
-
47
-
48
-
49
-
50
-
51
-
52
-
53
-
54
-
55
-
56
-
57
-
58
-
59
-
60
-
61
-
62
-
63
-
64
-
65
-
66
-
67
-
68
-
69
-
70
-
71
-
72
-
73
-
74
-
75
-
76
-
77
-
78
-
79
-
80
-
81
-
82
-
83
-
84
-
85
-
86
-
87
-
88
-
89
-
90
-
91
-
92
-
93
-
94
-
95
-
96
-
97
-
98
-
99
-
100
-
101
-
102
-
103
-
104
-
105
-
106
-
107
-
108
-
109
-
110
-
111
-
112
-
113
-
114
-
115
-
116
-
117
-
118
-
119
-
120
-
121
-
122
-
123
-
124
-
125
-
126
-
127
-
128
-
129
-
130
-
131
-
132
-
133
-
134
-
135
-
136
-
137
-
138
-
139
-
140
-
141
-
142
-
143
-
144
-
145
-
146
-
147
-
148
-
149
-
150
-
151
-
152
-
153
-
154
-
155
-
156
-
157
-
158
-
159
-
160
-
 161
161 -
 162
162 -
 163
163 -
 164
164 -
 165
165 -
 166
166 -
 167
167 -
 168
168 -
 169
169 -
 170
170 -
 171
171 -
 172
172 -
 173
173 -
 174
174 -
 175
175 -
 176
176 -
 177
177 -
 178
178 -
 179
179 -
 180
180 -
 181
181 -
182
-
183
-
184
-
185
-
186
-
187
-
188
-
189
-
190
-
191
-
192
-
193
-
194
-
195
-
196
-
197
-
198
-
199
-
200
-
201
-
202
-
203
-
204
-
205
-
206
-
207
-
208
-
209
-
210
-
211
-
212
-
213
-
214
-
215
-
216
-
217
-
218
-
219
-
220
-
221
-
222
-
223
-
224
-
225
-
226
-
227
-
228
-
229
-
230
-
231
-
232
-
233
-
234
-
235
-
236
-
237
-
238
-
239
-
240
-
241
-
242
-
243
-
244
-
245
-
246
-
247
-
248
-
249
-
250
-
251
-
252
-
253
 |
 |

CAPITAL ONE FINANCIAL CORPORATION
NOTES TO CONSOLIDATED FINANCIAL STATEMENTS
152 Capital One Financial Corporation (COF)
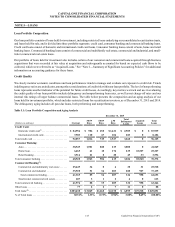
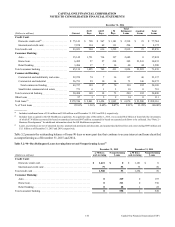
Commercial Banking
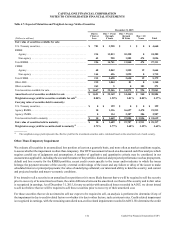
We evaluate the credit risk of commercial loans individually and use a risk-rating system to determine the credit quality of our
commercial loans. We assign internal risk ratings to loans based on relevant information about the ability of borrowers to service
their debt. In determining the risk rating of a particular loan, some of the factors considered are the borrower’s current financial
condition, historical credit performance, projected future credit performance, prospects for support from financially responsible
guarantors, the estimated realizable value of any collateral and current economic trends. The ratings scale based on our internal
risk-rating system is as follows:
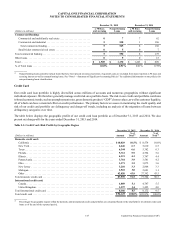
• Noncriticized: Loans that have not been designated as criticized, frequently referred to as “pass” loans.
• Criticized performing: Loans in which the financial condition of the obligor is stressed, affecting earnings, cash flows or
collateral values. The borrower currently has adequate capacity to meet near-term obligations; however, the stress, left
unabated, may result in deterioration of the repayment prospects at some future date.
• Criticized nonperforming: Loans that are not adequately protected by the current net worth and paying capacity of the
obligor or the collateral pledged, if any. Loans classified as criticized nonperforming have a well-defined weakness, or
weaknesses, which jeopardize the full repayment of the debt. These loans are characterized by the distinct possibility that
we will sustain a credit loss if the deficiencies are not corrected and are generally placed on nonaccrual status.
We use our internal risk-rating system for regulatory reporting, determining the frequency of credit exposure reviews, and evaluating
and determining the allowance for loan and lease losses for commercial loans. Loans of $1 million or more designated as criticized
performing and criticized nonperforming are reviewed quarterly by management for further deterioration or improvement to
determine if they are appropriately classified/rated and whether impairment exists. Noncriticized loans greater than $1 million are
specifically reviewed, at least annually, to determine the appropriate loan rating. In addition, we evaluate the risk rating during the
renewal process of any loan or if a loan becomes past due.
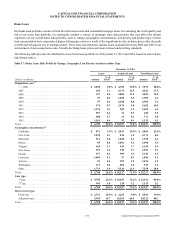
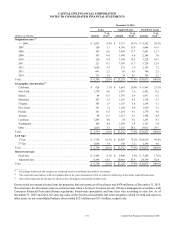
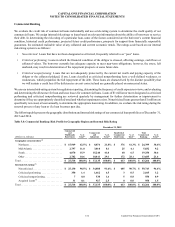
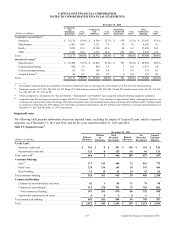
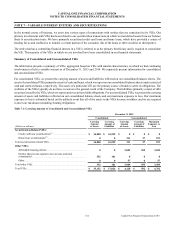
The following table presents the geographic distribution and internal risk ratings of our commercial loan portfolio as of December 31,
2015 and 2014.
Table 5.8: Commercial Banking: Risk Profile by Geographic Region and Internal Risk Rating
December 31, 2015
(Dollars in millions)
Commercial
and
Multifamily
Real Estate
% of
Total(1)
Commercial
and
Industrial
% of
Total(1)
Small-ticket
Commercial
Real Estate
% of
Total(1)
Total
Commercial
Banking
% of
Total(1)
Geographic concentration:(2)
Northeast . . . . . . . . . . . . . . . . . . . . . . . . . . $ 15,949 62.5% $ 8,074 21.8% $ 376 61.3% $ 24,399 38.6%
Mid-Atlantic . . . . . . . . . . . . . . . . . . . . . . . 2,797 11.0 3,010 8.1 25 4.1 5,832 9.2
South . . . . . . . . . . . . . . . . . . . . . . . . . . . . . 4,070 15.9 15,240 41.0 40 6.5 19,350 30.6
Other . . . . . . . . . . . . . . . . . . . . . . . . . . . . . 2,702 10.6 10,811 29.1 172 28.1 13,685 21.6
Total . . . . . . . . . . . . . . . . . . . . . . . . . . . . . . . . $ 25,518 100.0% $ 37,135 100.0% $ 613 100.0% $ 63,266 100.0%
Internal risk rating:(3)
Noncriticized. . . . . . . . . . . . . . . . . . . . . . . $ 25,130 98.5% $ 34,008 91.6% $ 605 98.7% $ 59,743 94.4%
Criticized performing . . . . . . . . . . . . . . . . 350 1.4 1,662 4.5 3 0.5 2,015 3.2
Criticized nonperforming . . . . . . . . . . . . . 7 0.0 538 1.4 5 0.8 550 0.9
Acquired Loans(4) . . . . . . . . . . . . . . . . . . . 31 0.1 927 2.5 0 0.0 958 1.5
Total . . . . . . . . . . . . . . . . . . . . . . . . . . . . . . . . $ 25,518 100.0% $ 37,135 100.0% $ 613 100.0% $ 63,266 100.0%