Sallie Mae 2005 Annual Report Download - page 99
Download and view the complete annual report
Please find page 99 of the 2005 Sallie Mae annual report below. You can navigate through the pages in the report by either clicking on the pages listed below, or by using the keyword search tool below to find specific information within the annual report.-
 1
1 -
2
-
3
-
4
-
5
-
6
-
7
-
8
-
9
-
10
-
11
-
12
-
13
-
14
-
15
-
16
-
17
-
18
-
19
-
20
-
21
-
22
-
23
-
24
-
25
-
26
-
27
-
28
-
29
-
30
-
31
-
32
-
33
-
34
-
35
-
36
-
37
-
38
-
39
-
40
-
41
-
42
-
43
-
44
-
45
-
46
-
47
-
48
-
49
-
50
-
51
-
52
-
53
-
54
-
55
-
56
-
57
-
58
-
59
-
60
-
61
-
62
-
63
-
64
-
65
-
66
-
67
-
68
-
69
-
70
-
71
-
72
-
73
-
74
-
75
-
76
-
77
-
78
-
79
-
80
-
81
-
82
-
83
-
84
-
85
-
86
-
87
-
88
-
 89
89 -
 90
90 -
 91
91 -
 92
92 -
 93
93 -
 94
94 -
 95
95 -
 96
96 -
 97
97 -
 98
98 -
 99
99 -
 100
100 -
 101
101 -
 102
102 -
 103
103 -
 104
104 -
 105
105 -
 106
106 -
 107
107 -
 108
108 -
 109
109 -
110
-
111
-
112
-
113
-
114
-
115
-
116
-
117
-
118
-
119
-
120
-
121
-
122
-
123
-
124
-
125
-
126
-
127
-
128
-
129
-
130
-
131
-
132
-
133
-
134
-
135
-
136
-
137
-
138
-
139
-
140
-
141
-
142
-
143
-
144
-
145
-
146
-
147
-
148
-
149
-
150
-
151
-
152
-
153
-
154
-
155
-
156
-
157
-
158
-
159
-
160
-
161
-
162
-
163
-
164
-
165
-
166
-
167
-
168
-
169
-
170
-
171
-
172
-
173
-
174
-
175
-
176
-
177
-
178
-
179
-
180
-
181
-
182
-
183
-
184
-
185
-
186
-
187
-
188
-
189
-
190
-
191
-
192
-
193
-
194
-
195
-
196
-
197
-
198
-
199
-
200
-
201
-
202
-
203
-
204
-
205
-
206
-
207
-
208
-
209
-
210
-
211
-
212
-
213
-
214
 |
 |

89
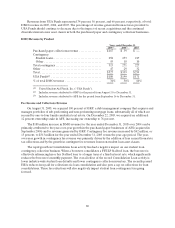
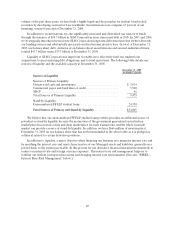
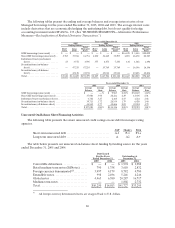
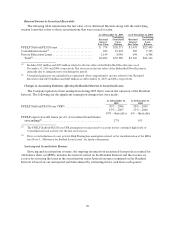
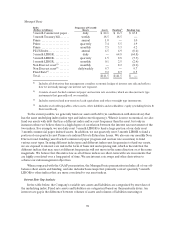
The following table summarizes our securitization activity for the years ended December 31, 2005,
2004 and 2003. Those securitizations listed as sales are off-balance sheet transactions and those listed as
financings remain on-balance sheet.
Year ended December 31,
2005 2004 2003
No. of
Transactions
Loan
Amount
Securitized
Per-Tax
Gain
Gain
%
No. of
Transactions
Loan
Amount
Securitized
Pre-Tax
Gain
Gain
%
No. of
Transactions
Loan
Amount
Securitized
Pre-Tax
Gain
Gain
%
FFELPStafford/PLUSloans........... 3 $ 6,533 $ 68 1.1% 4 $ 10,002 $ 134 1.3% 4 $ 5,772 $ 73 1.3%
ConsolidationLoans................. 2 4,011 31 .8 — — — — 2 4,256 433 10.2
Private Education Loans .............. 2 3,005 453 15.1 2 2,535 241 9.5 3 3,503 238 6.8
Total securitizations -sales ............. 7 13,549 $ 552 4.1% 6 12,537 $ 375 3.0% 9 13,531 $ 744 5.5%
Asset-backed commercial paper(1) ........ — — 1 4,186 — —
Consolidation Loans(2)................ 5 12,503 6 17,124 7 16,592
Total securitizations -financings......... 5 12,503 7 21,310 7 16,592
Total securitizations................. 12 $26,052 13 $ 33,847 16 $ 30,123
(1) The ABCP is a revolving 364-day multi seller conduit that allows the Company to borrow up to $5 billion subject to annual extensions. The Company may purchase loans out of this trust at its discretion and as a result, the trust does not
qualify as a QSPE and is accounted for on balance sheet as a VIE.
(2) In certain Consolidation Loan securitization structures, the Company holds certain rights that can affect the remarketing of certain bonds, such that these securitizations did not qualify as QSPEs. Accordingly, they are accounted for on
balance sheet as VIEs.
The increase in the gain as a percentage of the amount securitized for the 2005 Private Education
Loan securitizations versus the prior year’s transactions is primarily due to the higher earnings spreads on
the loans securitized in 2005, improved funding spreads, and a decrease in the CPR assumption used in the
calculation of the 2005 gains on sale. The 15.1 percent average gain on the Private Education Loan
securitizations basically reflects the average interest spread of 4.3 percent earned over an average life of
8.9 years less life of trust loan losses discounted at 12.3 percent. The decrease in the gain as a percentage of
the amount securitized for the 2005 Consolidation Loan securitizations versus the 2003 transactions is
primarily due to significantly less Embedded Floor Income due to interest rates increasing and fewer
higher rate loans being securitized.
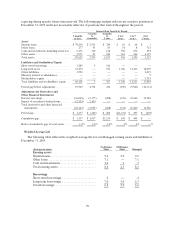
In 2004 we had record levels of securitization transactions due to funding new student loans acquired
through the acquisitions of Southwest and SLFA and to the refinancing of GSE debt in connection with
the Wind-Down. In 2005, as expected, there was a decline in our securitization activity to a level that
correlates with the volume of student loan purchases.
Liquidity Risk and Funding—Long-Term
With the dissolution of the GSE, our long-term funding, credit spread and liquidity exposure to the
corporate and asset-backed capital markets has increased significantly. A major disruption in the fixed
income capital markets that limits our ability to raise funds or significantly increases the cost of those funds
could have a material impact on our ability to acquire student loans, or on our results of operations. Going
forward, securitizations will continue to be the primary source of long-term financing and liquidity. Our
securitizations are structured such that we are not obligated to provide any material level of financial,
credit or liquidity support to any of the trusts, thus limiting our exposure to the recovery of the Retained
Interest asset on the balance sheet for off-balance sheet securitizations to the loss of the earnings spread
for loans securitized on-balance sheet. While all of our Retained Interests are subject to some prepayment
risk, Retained Interests from our FFELP Stafford securitizations have significant prepayment risk primarily
arising from borrowers opting to consolidate their Stafford/PLUS loans. When consolidation activity is higher
than projected, the increase in prepayment could materially impair the value of our Retained Interest.
However, this negative effect on our Retained Interest is somewhat offset by the loans that consolidate back
on our balance sheet, which we view as trading one interest bearing asset for another, whereas loans that
consolidate with third parties represent a complete economic loss to the Company. We discuss our short-term
liquidity risk, including a table of our sources of liquidity at the beginning of this “LIQUIDITY AND
CAPITAL RESOURCES” section.