Sallie Mae 2005 Annual Report Download - page 21
Download and view the complete annual report
Please find page 21 of the 2005 Sallie Mae annual report below. You can navigate through the pages in the report by either clicking on the pages listed below, or by using the keyword search tool below to find specific information within the annual report.-
 1
1 -
2
-
3
-
4
-
5
-
6
-
7
-
8
-
9
-
10
-
 11
11 -
 12
12 -
 13
13 -
 14
14 -
 15
15 -
 16
16 -
 17
17 -
 18
18 -
 19
19 -
 20
20 -
 21
21 -
 22
22 -
 23
23 -
 24
24 -
 25
25 -
 26
26 -
 27
27 -
 28
28 -
 29
29 -
 30
30 -
 31
31 -
32
-
33
-
34
-
35
-
36
-
37
-
38
-
39
-
40
-
41
-
42
-
43
-
44
-
45
-
46
-
47
-
48
-
49
-
50
-
51
-
52
-
53
-
54
-
55
-
56
-
57
-
58
-
59
-
60
-
61
-
62
-
63
-
64
-
65
-
66
-
67
-
68
-
69
-
70
-
71
-
72
-
73
-
74
-
75
-
76
-
77
-
78
-
79
-
80
-
81
-
82
-
83
-
84
-
85
-
86
-
87
-
88
-
89
-
90
-
91
-
92
-
93
-
94
-
95
-
96
-
97
-
98
-
99
-
100
-
101
-
102
-
103
-
104
-
105
-
106
-
107
-
108
-
109
-
110
-
111
-
112
-
113
-
114
-
115
-
116
-
117
-
118
-
119
-
120
-
121
-
122
-
123
-
124
-
125
-
126
-
127
-
128
-
129
-
130
-
131
-
132
-
133
-
134
-
135
-
136
-
137
-
138
-
139
-
140
-
141
-
142
-
143
-
144
-
145
-
146
-
147
-
148
-
149
-
150
-
151
-
152
-
153
-
154
-
155
-
156
-
157
-
158
-
159
-
160
-
161
-
162
-
163
-
164
-
165
-
166
-
167
-
168
-
169
-
170
-
171
-
172
-
173
-
174
-
175
-
176
-
177
-
178
-
179
-
180
-
181
-
182
-
183
-
184
-
185
-
186
-
187
-
188
-
189
-
190
-
191
-
192
-
193
-
194
-
195
-
196
-
197
-
198
-
199
-
200
-
201
-
202
-
203
-
204
-
205
-
206
-
207
-
208
-
209
-
210
-
211
-
212
-
213
-
214
 |
 |

11
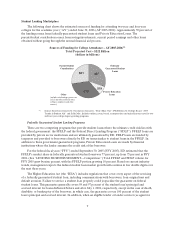
marketing Private Education Loans to foreign students studying in the U.S. This unit now also provides
dedicated service and support to our school and borrower customers.
Drivers of Growth in the Student Loan Industry
The growth in our Managed student loan portfolio, which includes both on-balance sheet and off-
balance sheet student loans, is driven by the growth in the overall student loan marketplace, which has
grown due to rising enrollment and college costs, as well as by our own market share gains. The size of the
federally insured student loan market has more than doubled over the last 10 years with student loan
originations growing from $26.1 billion in FFY 1995 to $64.5 billion in FFY 2005.
According to the College Board, tuition and fees at four-year public institutions and four-year private
institutions have increased 54 percent and 37 percent, respectively, in constant, inflation adjusted dollars,
since AY 1995-1996. Under the FFELP, there are limits to the amount students can borrow each academic
year. These loan limits have not changed since 1992. As a result, more students and parents are turning to
Private Education Loans to meet an increasing portion of their education financing needs. (See
“MANAGEMENT’S DISCUSSION AND ANALYSIS OF FINANCIAL CONDITION AND RESULTS
OF OPERATIONS—OTHER RELATED EVENTS AND INFORMATION—Reauthorization” for a
description of the recently signed bill that would increase loan limits for the first and second-year student
beginning in 2007.) Loans—both federal and private—as a percentage of total student aid have increased
from 51 percent of total student aid in AY 1994-1995 to 54 percent in AY 2004-2005. Private Education
Loans accounted for 22 percent of total student loans—both federally guaranteed and Private Education
Loans—in AY 2004-2005.
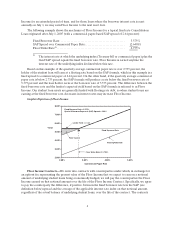
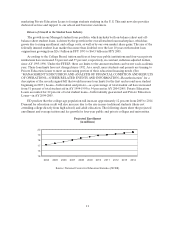
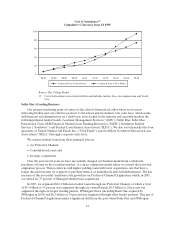
ED predicts that the college-age population will increase approximately 12 percent from 2005 to 2014.
Demand for education credit will also increase due to the rise in non-traditional students (those not
attending college directly from high school) and adult education. The following charts show the projected
enrollment and average tuition and fee growth for four-year public and private colleges and universities.
Projected Enrollment
(in millions)
15
16
17
18
19
20
2004 2005 2006 2007 2008 2009 2010 2011 2012 2013 2014
Source: National Center for Education Statistics (NCES)