Sallie Mae 2005 Annual Report Download - page 73
Download and view the complete annual report
Please find page 73 of the 2005 Sallie Mae annual report below. You can navigate through the pages in the report by either clicking on the pages listed below, or by using the keyword search tool below to find specific information within the annual report.-
 1
1 -
2
-
3
-
4
-
5
-
6
-
7
-
8
-
9
-
10
-
11
-
12
-
13
-
14
-
15
-
16
-
17
-
18
-
19
-
20
-
21
-
22
-
23
-
24
-
25
-
26
-
27
-
28
-
29
-
30
-
31
-
32
-
33
-
34
-
35
-
36
-
37
-
38
-
39
-
40
-
41
-
42
-
43
-
44
-
45
-
46
-
47
-
48
-
49
-
50
-
51
-
52
-
53
-
54
-
55
-
56
-
57
-
58
-
59
-
60
-
61
-
62
-
 63
63 -
 64
64 -
 65
65 -
 66
66 -
 67
67 -
 68
68 -
 69
69 -
 70
70 -
 71
71 -
 72
72 -
 73
73 -
 74
74 -
 75
75 -
 76
76 -
 77
77 -
 78
78 -
 79
79 -
 80
80 -
 81
81 -
 82
82 -
 83
83 -
84
-
85
-
86
-
87
-
88
-
89
-
90
-
91
-
92
-
93
-
94
-
95
-
96
-
97
-
98
-
99
-
100
-
101
-
102
-
103
-
104
-
105
-
106
-
107
-
108
-
109
-
110
-
111
-
112
-
113
-
114
-
115
-
116
-
117
-
118
-
119
-
120
-
121
-
122
-
123
-
124
-
125
-
126
-
127
-
128
-
129
-
130
-
131
-
132
-
133
-
134
-
135
-
136
-
137
-
138
-
139
-
140
-
141
-
142
-
143
-
144
-
145
-
146
-
147
-
148
-
149
-
150
-
151
-
152
-
153
-
154
-
155
-
156
-
157
-
158
-
159
-
160
-
161
-
162
-
163
-
164
-
165
-
166
-
167
-
168
-
169
-
170
-
171
-
172
-
173
-
174
-
175
-
176
-
177
-
178
-
179
-
180
-
181
-
182
-
183
-
184
-
185
-
186
-
187
-
188
-
189
-
190
-
191
-
192
-
193
-
194
-
195
-
196
-
197
-
198
-
199
-
200
-
201
-
202
-
203
-
204
-
205
-
206
-
207
-
208
-
209
-
210
-
211
-
212
-
213
-
214
 |
 |

63
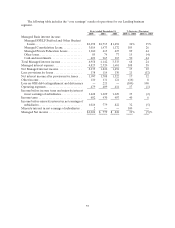
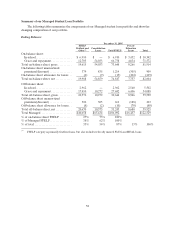
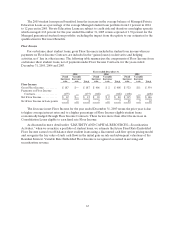
The 2005 student loan spread benefited from the increase in the average balance of Managed Private
Education Loans as a percentage of the average Managed student loan portfolio from 11 percent in 2004
to 12 percent in 2005. Private Education Loans are subject to credit risk and therefore earn higher spreads
which averaged 4.62 percent for the year ended December 31, 2005 versus a spread of 1.39 percent for the
Managed guaranteed student loan portfolio, excluding the impact from the update to our estimates for the
qualification for Borrower Benefits.
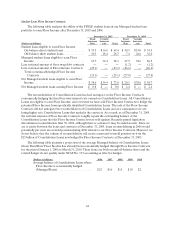
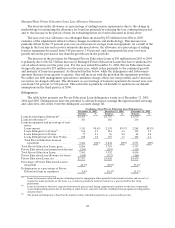
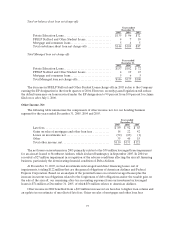
Floor Income
For on-balance sheet student loans, gross Floor Income is included in student loan income whereas
payments on Floor Income Contracts are included in the “gains (losses) on derivative and hedging
activities, net” line in other income. The following table summarizes the components of Floor Income from
on-balance sheet student loans, net of payments under Floor Income Contracts, for the years ended
December 31, 2005, 2004 and 2003.
Years ended December 31,
2005 2004 2003
Fixed
borrower
rate
Variable
borrower
rate Total
Fixed
borrower
rate
Variable
borrower
rate Total
Fixed
borrower
rate
Variable
borrower
rate Total
Floor Income:
Gross Floor Income.......... $ 187 $ — $ 187 $ 406 $ 2 $ 408 $ 523 $ 31 $ 554
Payments on Floor Income
Contracts................. (175 ) — (175) (368) — (368) (408 ) — (408)
Net Floor Income............ $ 12 $ — $ 12 $ 38 $ 2 $ 40 $ 115 $ 31 $ 146
Net Floor Income in basis points 2 — 2 7 — 7 25 7 32
The decrease in net Floor Income for the year ended December 31, 2005 versus the prior year is due
to higher average interest rates and to a higher percentage of Floor Income-eligible student loans
economically hedged through Floor Income Contracts. These factors more than offset the increase in
Consolidation Loans eligible to earn fixed rate Floor Income.
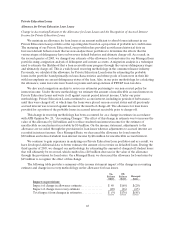
As discussed in more detail under “LIQUIDITY AND CAPITAL RESOURCES—Securitization
Activities,” when we securitize a portfolio of student loans, we estimate the future Fixed Rate Embedded
Floor Income earned on off-balance sheet student loans using a discounted cash flow option pricing model
and recognize the fair value of such cash flows in the initial gain on sale and subsequent valuations of the
Residual Interest. Variable Rate Embedded Floor Income is recognized as earned in servicing and
securitization revenue.