Sallie Mae 2005 Annual Report Download - page 54
Download and view the complete annual report
Please find page 54 of the 2005 Sallie Mae annual report below. You can navigate through the pages in the report by either clicking on the pages listed below, or by using the keyword search tool below to find specific information within the annual report.-
 1
1 -
2
-
3
-
4
-
5
-
6
-
7
-
8
-
9
-
10
-
11
-
12
-
13
-
14
-
15
-
16
-
17
-
18
-
19
-
20
-
21
-
22
-
23
-
24
-
25
-
26
-
27
-
28
-
29
-
30
-
31
-
32
-
33
-
34
-
35
-
36
-
37
-
38
-
39
-
40
-
41
-
42
-
43
-
 44
44 -
 45
45 -
 46
46 -
 47
47 -
 48
48 -
 49
49 -
 50
50 -
 51
51 -
 52
52 -
 53
53 -
 54
54 -
 55
55 -
 56
56 -
 57
57 -
 58
58 -
 59
59 -
 60
60 -
 61
61 -
 62
62 -
 63
63 -
 64
64 -
65
-
66
-
67
-
68
-
69
-
70
-
71
-
72
-
73
-
74
-
75
-
76
-
77
-
78
-
79
-
80
-
81
-
82
-
83
-
84
-
85
-
86
-
87
-
88
-
89
-
90
-
91
-
92
-
93
-
94
-
95
-
96
-
97
-
98
-
99
-
100
-
101
-
102
-
103
-
104
-
105
-
106
-
107
-
108
-
109
-
110
-
111
-
112
-
113
-
114
-
115
-
116
-
117
-
118
-
119
-
120
-
121
-
122
-
123
-
124
-
125
-
126
-
127
-
128
-
129
-
130
-
131
-
132
-
133
-
134
-
135
-
136
-
137
-
138
-
139
-
140
-
141
-
142
-
143
-
144
-
145
-
146
-
147
-
148
-
149
-
150
-
151
-
152
-
153
-
154
-
155
-
156
-
157
-
158
-
159
-
160
-
161
-
162
-
163
-
164
-
165
-
166
-
167
-
168
-
169
-
170
-
171
-
172
-
173
-
174
-
175
-
176
-
177
-
178
-
179
-
180
-
181
-
182
-
183
-
184
-
185
-
186
-
187
-
188
-
189
-
190
-
191
-
192
-
193
-
194
-
195
-
196
-
197
-
198
-
199
-
200
-
201
-
202
-
203
-
204
-
205
-
206
-
207
-
208
-
209
-
210
-
211
-
212
-
213
-
214
 |
 |

44
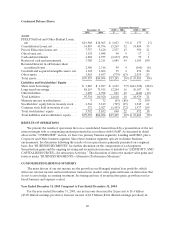
impacted by the higher average balances of lower yielding short-term investments which were being built
up during 2004 as additional liquidity in anticipation of the GSE Wind-Down.
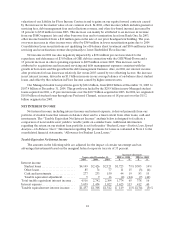
Student Loans
For both federally insured student loans and Private Education Loans, we account for premiums paid,
discounts received and certain origination costs incurred on the origination of student loans in accordance
with SFAS No. 91. The unamortized portion of the premiums and discounts are included in the carrying
value of the student loan on the consolidated balance sheet. We recognize income on our student loan
portfolio based on the expected yield of the student loan after giving effect to the amortization of purchase
premiums and the accretion of student loan discounts, as well as the discount expected to be earned
through Borrower Benefits programs. Discounts on Private Education Loans are deferred and accreted to
income over the lives of the student loans. In the table below, this accretion of discounts is netted with the
amortization of the premiums.
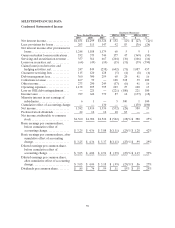
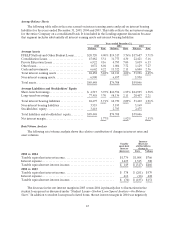
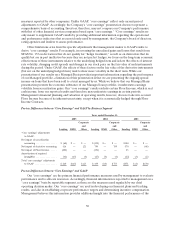
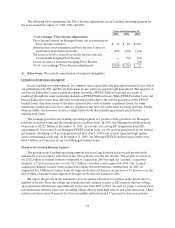
Student Loan Spread Analysis—On-Balance Sheet
The following table analyzes the reported earnings from student loans both on-balance sheet and
those off-balance sheet in securitization trusts. For student loans off-balance sheet, we will continue to
earn securitization and servicing fee revenues over the life of the securitized loan portfolios. The off-
balance sheet information is discussed in more detail in “LIQUIDITY AND CAPITAL RESOURCES—
Securitization Activities—Servicing and Securitization Revenue” where we analyze the on-going servicing
revenue and Residual Interest earned on the securitized portfolios of student loans. For an analysis of our
student loan spread for the entire portfolio of Managed student loans on a similar basis to the on-balance
sheet analysis, see “LENDING BUSINESS SEGMENT—Student Loan Spread Analysis—Managed Basis.”
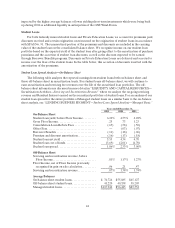
Years ended December 31,
2005 2004 2003
On-Balance Sheet
Student loan yield, before Floor Income ......... 6.22% 4.53% 4.28 %
Gross FloorIncome........................... .25 .73 1.23
Consolidation Loan Rebate Fees ............... (.65) (.58) (.50 )
Offset Fees................................... — (.03) (.07 )
Borrower Benefits ............................ (.11) (.18) (.06 )
Premium anddiscount amortization............. (.16) (.13) (.18 )
Student loannet yield ......................... 5.55 4.34 4.70
Student loan cost offunds...................... (3.69) (2.01) (1.70 )
Student loan spread........................... 1.86% 2.33% 3.00 %
Off-Balance Sheet
Servicing and securitization revenue, before
Floor Income............................... .81% 1.17 % 1.27 %
Floor Income, net of Floor Income previously
recognized ingain on sale calculation.......... .06 .21 .47
Servicingand securitization revenue............. .87% 1.38% 1.74 %
Average Balances
On-balance sheet student loans ................. $ 74,724 $55,885 $ 45,127
Off-balance sheet student loans................. 41,220 40,558 38,205
Managed student loans........................ $115,944 $96,443 $ 83,332