Sallie Mae 2005 Annual Report Download - page 182
Download and view the complete annual report
Please find page 182 of the 2005 Sallie Mae annual report below. You can navigate through the pages in the report by either clicking on the pages listed below, or by using the keyword search tool below to find specific information within the annual report.-
 1
1 -
2
-
3
-
4
-
5
-
6
-
7
-
8
-
9
-
10
-
11
-
12
-
13
-
14
-
15
-
16
-
17
-
18
-
19
-
20
-
21
-
22
-
23
-
24
-
25
-
26
-
27
-
28
-
29
-
30
-
31
-
32
-
33
-
34
-
35
-
36
-
37
-
38
-
39
-
40
-
41
-
42
-
43
-
44
-
45
-
46
-
47
-
48
-
49
-
50
-
51
-
52
-
53
-
54
-
55
-
56
-
57
-
58
-
59
-
60
-
61
-
62
-
63
-
64
-
65
-
66
-
67
-
68
-
69
-
70
-
71
-
72
-
73
-
74
-
75
-
76
-
77
-
78
-
79
-
80
-
81
-
82
-
83
-
84
-
85
-
86
-
87
-
88
-
89
-
90
-
91
-
92
-
93
-
94
-
95
-
96
-
97
-
98
-
99
-
100
-
101
-
102
-
103
-
104
-
105
-
106
-
107
-
108
-
109
-
110
-
111
-
112
-
113
-
114
-
115
-
116
-
117
-
118
-
119
-
120
-
121
-
122
-
123
-
124
-
125
-
126
-
127
-
128
-
129
-
130
-
131
-
132
-
133
-
134
-
135
-
136
-
137
-
138
-
139
-
140
-
141
-
142
-
143
-
144
-
145
-
146
-
147
-
148
-
149
-
150
-
151
-
152
-
153
-
154
-
155
-
156
-
157
-
158
-
159
-
160
-
161
-
162
-
163
-
164
-
165
-
166
-
167
-
168
-
169
-
170
-
171
-
 172
172 -
 173
173 -
 174
174 -
 175
175 -
 176
176 -
 177
177 -
 178
178 -
 179
179 -
 180
180 -
 181
181 -
 182
182 -
 183
183 -
 184
184 -
 185
185 -
 186
186 -
 187
187 -
 188
188 -
 189
189 -
 190
190 -
 191
191 -
 192
192 -
193
-
194
-
195
-
196
-
197
-
198
-
199
-
200
-
201
-
202
-
203
-
204
-
205
-
206
-
207
-
208
-
209
-
210
-
211
-
212
-
213
-
214
 |
 |

SLM CORPORATION
NOTES TO CONSOLIDATED FINANCIAL STATEMENTS (Continued)
(Dollars in thousands, except per share amounts, unless otherwise stated)
F-60
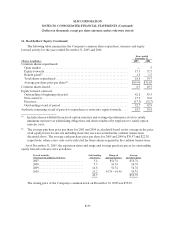
16. Stock-Based Compensation Plans (Continued)
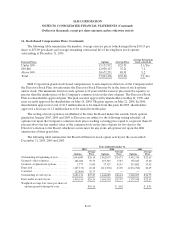
The following table summarizes the number, average exercise prices (which ranged from $10.13 per
share to $55.09 per share) and average remaining contractual life of the employee stock options
outstanding at December 31, 2005.
Exercise Prices Options Average Price
Average Remaining
Contractual Life
Under $30........................................... 15,132,912 $25.51 5.6.Yrs
$30-$40............................................. 12,058,113 35.21 7.2
Above $40........................................... 10,672,231 48.91 9.2
Total ............................................... 37,863,256 $35.20 7.1.Yrs
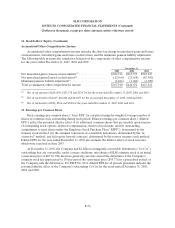
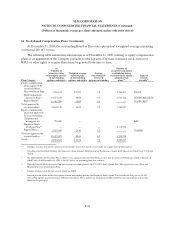
SLM Corporation grants stock-based compensation to non-employee directors of the Company under
the Directors Stock Plan. Awards under the Directors Stock Plan may be in the form of stock options
and/or stock. The maximum term for stock options is 10 years and the exercise price must be equal to or
greater than the market price of the Company’s common stock on the date of grant. The Directors Stock
Plan is a shareholder-approved plan. The plan was first approved by shareholders on May 21, 1998, and
most recently approved by shareholders on May 18, 2000. The plan expires on May 21, 2008. In 2000,
shareholders approved a total of 10.5 million shares to be issued from this plan. In 2005, shareholders
approved a decrease of 1.2 million shares to be issued from this plan.
The vesting of stock options is established at the time the Board makes the awards. Stock options
granted in January 2003, 2004 and 2005 to Directors are subject to the following vesting schedule: all
options vest upon the Company’s common stock price reaching a closing price equal to or greater than 20
percent above the fair market value of the common stock on the date of grant for five days or the
Director’s election to the Board, whichever occurs later. In any event, all options vest upon the fifth
anniversary of their grant date.
The following table summarizes the Board of Directors stock option activity for the years ended
December 31, 2005, 2004 and 2003.
Years Ended December 31,
2005 2004 2003
Options
Average
Price Options
Average
Price Options
Average
Price
Outstanding at beginning of year ....... 3,644,089 $ 26.14 3,962,055 $ 24.75 4,412,310 $ 22.65
Granted—direct options .............. 182,060 50.75 255,545 37.87 350,625 35.20
Granted—replacement options......... 5,775 53.00 37,527 42.43 235,882 39.42
Exercised........................... (187,733) 22.18 (611,038) 23.00 (1,036,762 ) 22.69
Canceled ........................... (22,880) 50.75 — — — —
Outstanding at end of year ............ 3,621,311 $ 27.47 3,644,089 $ 26.14 3,962,055 $ 24.75
Exercisable at end of year............. 3,456,356 $ 26.36 3,606,562 $ 25.97 3,375,548 $ 22.63
Weighted-average fair value per share of
options granted during the year...... $ 10.56 $ 4.62 $ 8.93