Sallie Mae 2005 Annual Report Download - page 96
Download and view the complete annual report
Please find page 96 of the 2005 Sallie Mae annual report below. You can navigate through the pages in the report by either clicking on the pages listed below, or by using the keyword search tool below to find specific information within the annual report.-
 1
1 -
2
-
3
-
4
-
5
-
6
-
7
-
8
-
9
-
10
-
11
-
12
-
13
-
14
-
15
-
16
-
17
-
18
-
19
-
20
-
21
-
22
-
23
-
24
-
25
-
26
-
27
-
28
-
29
-
30
-
31
-
32
-
33
-
34
-
35
-
36
-
37
-
38
-
39
-
40
-
41
-
42
-
43
-
44
-
45
-
46
-
47
-
48
-
49
-
50
-
51
-
52
-
53
-
54
-
55
-
56
-
57
-
58
-
59
-
60
-
61
-
62
-
63
-
64
-
65
-
66
-
67
-
68
-
69
-
70
-
71
-
72
-
73
-
74
-
75
-
76
-
77
-
78
-
79
-
80
-
81
-
82
-
83
-
84
-
85
-
 86
86 -
 87
87 -
 88
88 -
 89
89 -
 90
90 -
 91
91 -
 92
92 -
 93
93 -
 94
94 -
 95
95 -
 96
96 -
 97
97 -
 98
98 -
 99
99 -
 100
100 -
 101
101 -
 102
102 -
 103
103 -
 104
104 -
 105
105 -
 106
106 -
107
-
108
-
109
-
110
-
111
-
112
-
113
-
114
-
115
-
116
-
117
-
118
-
119
-
120
-
121
-
122
-
123
-
124
-
125
-
126
-
127
-
128
-
129
-
130
-
131
-
132
-
133
-
134
-
135
-
136
-
137
-
138
-
139
-
140
-
141
-
142
-
143
-
144
-
145
-
146
-
147
-
148
-
149
-
150
-
151
-
152
-
153
-
154
-
155
-
156
-
157
-
158
-
159
-
160
-
161
-
162
-
163
-
164
-
165
-
166
-
167
-
168
-
169
-
170
-
171
-
172
-
173
-
174
-
175
-
176
-
177
-
178
-
179
-
180
-
181
-
182
-
183
-
184
-
185
-
186
-
187
-
188
-
189
-
190
-
191
-
192
-
193
-
194
-
195
-
196
-
197
-
198
-
199
-
200
-
201
-
202
-
203
-
204
-
205
-
206
-
207
-
208
-
209
-
210
-
211
-
212
-
213
-
214
 |
 |

86
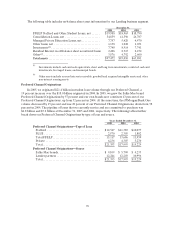
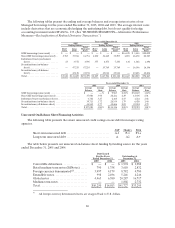
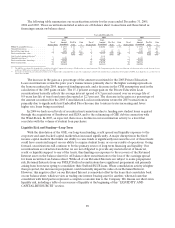
The following tables present the ending and average balances and average interest rates of our
Managed borrowings for the years ended December 31, 2005, 2004 and 2003. The average interest rates
include derivatives that are economically hedging the underlying debt, but do not qualify for hedge
accounting treatment under SFAS No. 133. (See “BUSINESS SEGMENTS—Alternative Performance
Measures—Reclassification of Realized Derivative Transactions.”)
Years ended December 31,
2005 2004 2003
Ending Balance Ending Balance Ending Balance
Short
Term Long
Term
Total
Managed
Basis Short
Term Long
Term
Total
Managed
Basis Short
Term Long
Term
Total
Managed
Basis
GSE borrowings (unsecured) ...... $ — $ — $ — $ — $ — $ — $ 16,678 $ 3,414 $ 20,092
Non-GSE borrowings (unsecured) . . 3,787 37,944 41,731 1,830 31,465 33,295 1,855 18,472 20,327
Indentured trusts (on-balance
sheet)....................... 23 3,372 3,395 377 6,873 7,250 134 1,362 1,496
Securitizations (on-balance
sheet)....................... — 47,235 47,235 — 35,769 35,769 — 16,346 16,346
Securitizations (off-balance
sheet)....................... — 43,138 43,138 — 43,814 43,814 — 40,606 40,606
Total......................... $3,810 $131,689 $135,499 $2,207 $117,921 $120,128 $18,667 $ 80,200 $ 98,867
Years ended December 31,
2005 2004 2003
Average
Balance
Average
Rate
Average
Balance
Average
Rate
Average
Balance
Average
Rate
GSE borrowings (unsecured) ........................ $ — —% $ 9,967 2.21% $32,847 1.80%
Non-GSE borrowings (unsecured) .................... 37,980 3.98 28,241 2.29 13,305 2.01
Indentured trusts (on-balance sheet) .................. 4,782 3.27 2,168 2.47 1,221 2.68
Securitizations (on-balance sheet).................... 39,713 3.72 28,354 1.79 6,026 1.40
Securitizations (off-balance sheet).................... 44,545 3.77 42,606 2.09 39,524 1.79
Total........................................... $ 127,020 3.80% $ 111,336 2.08% $ 92,923 1.81%
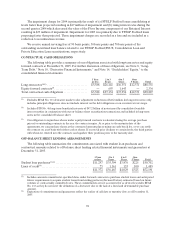
Unsecured On-Balance Sheet Financing Activities
The following table presents the senior unsecured credit ratings on our debt from major rating
agencies.
S&P Moody’s Fitch
Short-term unsecured debt............................... A-1 P-1 F1+
Long-term unsecured debt............................... A A2 A+
The table below presents our unsecured on-balance sheet funding by funding source for the years
ended December 31, 2005 and 2004.
Debt Issued
For the Years
Ended December 31,
Outstanding at
December 31,
2005 2004 2005 2004
Convertibledebentures.................. $ — $ — $ 1,992 $ 1,988
Retail medium-term notes (EdNotes) ..... 790 1,758 3,618 2,832
Foreign currency denominated(1).......... 3,997 4,179 8,782 4,780
Extendiblenotes........................ 998 2,496 5,246 4,246
Globalnotes ........................... 4,465 6,380 20,287 16,717
Medium-term notes ..................... — — 1,802 2,732
Total.................................. $10,250 $14,813 $41,727 $ 33,295
(1) All foreign currency denominated notes are swapped back to U.S. dollars.