Sallie Mae 2005 Annual Report Download - page 88
Download and view the complete annual report
Please find page 88 of the 2005 Sallie Mae annual report below. You can navigate through the pages in the report by either clicking on the pages listed below, or by using the keyword search tool below to find specific information within the annual report.-
 1
1 -
2
-
3
-
4
-
5
-
6
-
7
-
8
-
9
-
10
-
11
-
12
-
13
-
14
-
15
-
16
-
17
-
18
-
19
-
20
-
21
-
22
-
23
-
24
-
25
-
26
-
27
-
28
-
29
-
30
-
31
-
32
-
33
-
34
-
35
-
36
-
37
-
38
-
39
-
40
-
41
-
42
-
43
-
44
-
45
-
46
-
47
-
48
-
49
-
50
-
51
-
52
-
53
-
54
-
55
-
56
-
57
-
58
-
59
-
60
-
61
-
62
-
63
-
64
-
65
-
66
-
67
-
68
-
69
-
70
-
71
-
72
-
73
-
74
-
75
-
76
-
77
-
 78
78 -
 79
79 -
 80
80 -
 81
81 -
 82
82 -
 83
83 -
 84
84 -
 85
85 -
 86
86 -
 87
87 -
 88
88 -
 89
89 -
 90
90 -
 91
91 -
 92
92 -
 93
93 -
 94
94 -
 95
95 -
 96
96 -
 97
97 -
 98
98 -
99
-
100
-
101
-
102
-
103
-
104
-
105
-
106
-
107
-
108
-
109
-
110
-
111
-
112
-
113
-
114
-
115
-
116
-
117
-
118
-
119
-
120
-
121
-
122
-
123
-
124
-
125
-
126
-
127
-
128
-
129
-
130
-
131
-
132
-
133
-
134
-
135
-
136
-
137
-
138
-
139
-
140
-
141
-
142
-
143
-
144
-
145
-
146
-
147
-
148
-
149
-
150
-
151
-
152
-
153
-
154
-
155
-
156
-
157
-
158
-
159
-
160
-
161
-
162
-
163
-
164
-
165
-
166
-
167
-
168
-
169
-
170
-
171
-
172
-
173
-
174
-
175
-
176
-
177
-
178
-
179
-
180
-
181
-
182
-
183
-
184
-
185
-
186
-
187
-
188
-
189
-
190
-
191
-
192
-
193
-
194
-
195
-
196
-
197
-
198
-
199
-
200
-
201
-
202
-
203
-
204
-
205
-
206
-
207
-
208
-
209
-
210
-
211
-
212
-
213
-
214
 |
 |

78
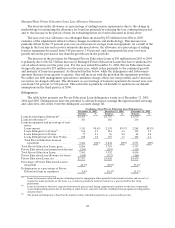
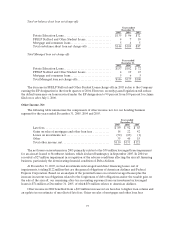
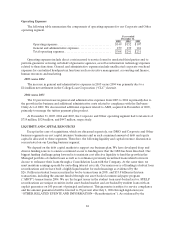
Operating Expenses
The following table summarizes the components of operating expenses for our Lending business
segment for the years ended December 31, 2005, 2004 and 2003.
Years ended
December 31,
2005 2004 2003
Sales and originations .................................... $286 $259 $256
Servicing andinformation technology....................... 193 150 158
Total operating expenses.................................. $479 $409 $414
Loss on GSEdebt extinguishment and defeasance ........... $ — $221 $ —
Operating expenses for our Lending operating segment include non-capitalizable costs incurred to
acquire student loans and service our Managed student loan portfolio, as well as other selling, general and
administrative expenses.
The $221 million loss in 2004 relates to the repurchase and defeasance of approximately $3.0 billion of
GSE debt in connection with the Wind-Down of the GSE.
2005 versus 2004
Operating expenses for the year ended December 31, 2005, increased by 17 percent to $479 million
versus $409 million in the prior year, exclusive of the loss on GSE debt extinguishment and defeasance.
The increase is due to increased sales and marketing costs related to the Consolidation Loan program, new
Private Education Loan initiatives and the launch of our direct to consumer initiative, Tuition Answer.
Operating expenses were also higher due to a full year of expenses of sales and marketing personnel from
Southwest and SLFA, acquired in the fourth quarter of 2004. The $43 million increase in servicing and
information technology expenses is consistent with the growth in borrowers.
2004 versus 2003
Operating expenses for the year ended December 31, 2004, exclusive of the loss on GSE debt
extinguishment and defeasance discussed above, were relatively flat at $409 million versus $414 million in
2003.
DEBT MANAGEMENT OPERATIONS (“DMO”) BUSINESS SEGMENT
Through the six operating units that comprise our DMO operating segment, we provide a wide range
of accounts receivable and collections services including student loan default aversion services, defaulted
student loan portfolio management services, contingency collections services for student loans and other
asset classes, and accounts receivable management and collection for purchased portfolios of receivables
that are delinquent or have been charged off by their original creditors as well as sub-performing and non-
performing mortgage loans.
In our DMO segment, nearly half of our revenues are still earned from our student loan contingency
collection fee business in which we provide default management services to guarantor agencies, colleges
and universities and ED. In recent years, we have diversified our DMO contingency revenue stream away
from student loans, mainly through the acquisition of AFS in 2004 and GRP in 2005. These acquisitions
also diversified our revenue from purely contingency fee collections to purchased paper collections. As a
result, student loan contingency fees contributed 49 percent of total DMO revenue in 2005, versus
75 percent in 2004.