Sallie Mae 2005 Annual Report Download - page 74
Download and view the complete annual report
Please find page 74 of the 2005 Sallie Mae annual report below. You can navigate through the pages in the report by either clicking on the pages listed below, or by using the keyword search tool below to find specific information within the annual report.-
 1
1 -
2
-
3
-
4
-
5
-
6
-
7
-
8
-
9
-
10
-
11
-
12
-
13
-
14
-
15
-
16
-
17
-
18
-
19
-
20
-
21
-
22
-
23
-
24
-
25
-
26
-
27
-
28
-
29
-
30
-
31
-
32
-
33
-
34
-
35
-
36
-
37
-
38
-
39
-
40
-
41
-
42
-
43
-
44
-
45
-
46
-
47
-
48
-
49
-
50
-
51
-
52
-
53
-
54
-
55
-
56
-
57
-
58
-
59
-
60
-
61
-
62
-
63
-
 64
64 -
 65
65 -
 66
66 -
 67
67 -
 68
68 -
 69
69 -
 70
70 -
 71
71 -
 72
72 -
 73
73 -
 74
74 -
 75
75 -
 76
76 -
 77
77 -
 78
78 -
 79
79 -
 80
80 -
 81
81 -
 82
82 -
 83
83 -
 84
84 -
85
-
86
-
87
-
88
-
89
-
90
-
91
-
92
-
93
-
94
-
95
-
96
-
97
-
98
-
99
-
100
-
101
-
102
-
103
-
104
-
105
-
106
-
107
-
108
-
109
-
110
-
111
-
112
-
113
-
114
-
115
-
116
-
117
-
118
-
119
-
120
-
121
-
122
-
123
-
124
-
125
-
126
-
127
-
128
-
129
-
130
-
131
-
132
-
133
-
134
-
135
-
136
-
137
-
138
-
139
-
140
-
141
-
142
-
143
-
144
-
145
-
146
-
147
-
148
-
149
-
150
-
151
-
152
-
153
-
154
-
155
-
156
-
157
-
158
-
159
-
160
-
161
-
162
-
163
-
164
-
165
-
166
-
167
-
168
-
169
-
170
-
171
-
172
-
173
-
174
-
175
-
176
-
177
-
178
-
179
-
180
-
181
-
182
-
183
-
184
-
185
-
186
-
187
-
188
-
189
-
190
-
191
-
192
-
193
-
194
-
195
-
196
-
197
-
198
-
199
-
200
-
201
-
202
-
203
-
204
-
205
-
206
-
207
-
208
-
209
-
210
-
211
-
212
-
213
-
214
 |
 |

64
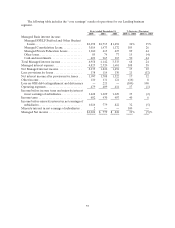
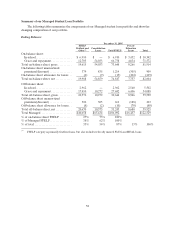
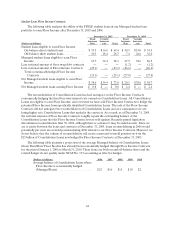
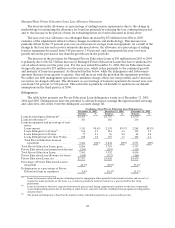
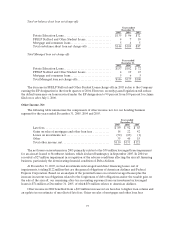
Student Loan Floor Income Contracts
The following table analyzes the ability of the FFELP student loans in our Managed student loan
portfolio to earn Floor Income after December 31, 2005 and 2004.
December 31, 2005 December 31, 2004
(Dollars in billions)
Fixed
borrower
Rate
Variable
borrower
rate Total
Fixed
borrower
Rate
Variable
borrower
rate Total
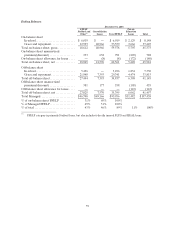
Student loans eligible to earn Floor Income:
On-balance sheet student loans ............... $ 53.4 $16.0 $ 69.4 $ 40.5 $14.0 $ 54.5
Off-balance sheet student loans ............... 10.3 18.4 28.7 7.4 24.6 32.0
Managed student loans eligible to earn Floor
Income .................................... 63.7 34.4 98.1 47.9 38.6 86.5
Less: notional amount of floor swap/debt contracts — — — (1.2 ) — (1.2)
Less: notional amount of Floor Income Contracts . (25.1) — (25.1) (26.6 ) — (26.6)
Total economically hedged Floor Income
Contracts ................................ (25.1) — (25.1) (27.8 ) — (27.8)
Net Managed student loans eligible to earn Floor
Income .................................... $ 38.6 $34.4 $ 73.0 $ 20.1 $38.6 $ 58.7
Net Managed student loans earning Floor Income. $ 0.8 $ — $ 0.8 $ 2.4 $ — $ 2.4
The reconsolidation of Consolidation Loans has had an impact on the Floor Income Contracts
economically hedging the fixed borrower interest rate earned on Consolidation Loans. All Consolidation
Loans are eligible to earn Floor Income, and over time we have sold Floor Income Contracts to hedge the
potential Floor Income from specifically identified Consolidation Loans. The sale of the Floor Income
Contracts did not anticipate the reconsolidation of Consolidation Loans and as a consequence we are
losing higher rate Consolidation Loans that underlie the contracts. As a result, as of December 31, 2005,
the notional amount of Floor Income Contracts roughly equals the outstanding balance of the
Consolidation Loans that the Floor Income Contracts were sold against. Recently passed legislation
discontinues reconsolidation June 30, 2006, although there is a chance it may be ended sooner. Since we
are at parity between the loans and contracts at December 31, 2005, loans reconsolidating in 2006 would
potentially put us in an oversold position during 2006 related to our Floor Income Contracts. However, we
do not believe that the volume of reconsolidation will create a material oversold position vis-à-vis the
$25 billion of Consolidation Loans now hedged by Floor Income Contracts at December 31, 2005.
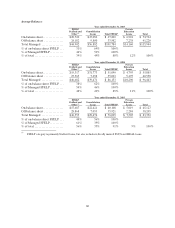
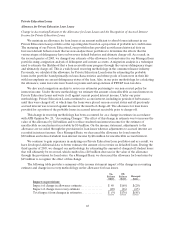
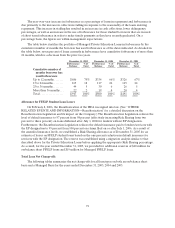
The following table presents a projection of the average Managed balance of Consolidation Loans
whose Fixed Rate Floor Income has already been economically hedged through Floor Income Contracts
for the period January 1, 2006 to March 31, 2010. These loans are both on and off-balance sheet and the
related hedges do not qualify under SFAS No. 133 accounting as effective hedges.
(Dollars in billions) 2006 2007 2008 2009 2010
Average balance of Consolidation Loans whose
Floor Income is economically hedged
(Managed Basis)......................... $ 25 $ 16 $ 15 $ 10 $ 2