Sallie Mae 2005 Annual Report Download - page 150
Download and view the complete annual report
Please find page 150 of the 2005 Sallie Mae annual report below. You can navigate through the pages in the report by either clicking on the pages listed below, or by using the keyword search tool below to find specific information within the annual report.-
 1
1 -
2
-
3
-
4
-
5
-
6
-
7
-
8
-
9
-
10
-
11
-
12
-
13
-
14
-
15
-
16
-
17
-
18
-
19
-
20
-
21
-
22
-
23
-
24
-
25
-
26
-
27
-
28
-
29
-
30
-
31
-
32
-
33
-
34
-
35
-
36
-
37
-
38
-
39
-
40
-
41
-
42
-
43
-
44
-
45
-
46
-
47
-
48
-
49
-
50
-
51
-
52
-
53
-
54
-
55
-
56
-
57
-
58
-
59
-
60
-
61
-
62
-
63
-
64
-
65
-
66
-
67
-
68
-
69
-
70
-
71
-
72
-
73
-
74
-
75
-
76
-
77
-
78
-
79
-
80
-
81
-
82
-
83
-
84
-
85
-
86
-
87
-
88
-
89
-
90
-
91
-
92
-
93
-
94
-
95
-
96
-
97
-
98
-
99
-
100
-
101
-
102
-
103
-
104
-
105
-
106
-
107
-
108
-
109
-
110
-
111
-
112
-
113
-
114
-
115
-
116
-
117
-
118
-
119
-
120
-
121
-
122
-
123
-
124
-
125
-
126
-
127
-
128
-
129
-
130
-
131
-
132
-
133
-
134
-
135
-
136
-
137
-
138
-
139
-
 140
140 -
 141
141 -
 142
142 -
 143
143 -
 144
144 -
 145
145 -
 146
146 -
 147
147 -
 148
148 -
 149
149 -
 150
150 -
 151
151 -
 152
152 -
 153
153 -
 154
154 -
 155
155 -
 156
156 -
 157
157 -
 158
158 -
 159
159 -
 160
160 -
161
-
162
-
163
-
164
-
165
-
166
-
167
-
168
-
169
-
170
-
171
-
172
-
173
-
174
-
175
-
176
-
177
-
178
-
179
-
180
-
181
-
182
-
183
-
184
-
185
-
186
-
187
-
188
-
189
-
190
-
191
-
192
-
193
-
194
-
195
-
196
-
197
-
198
-
199
-
200
-
201
-
202
-
203
-
204
-
205
-
206
-
207
-
208
-
209
-
210
-
211
-
212
-
213
-
214
 |
 |

SLM CORPORATION
NOTES TO CONSOLIDATED FINANCIAL STATEMENTS (Continued)
(Dollars in thousands, except per share amounts, unless otherwise stated)
F-28
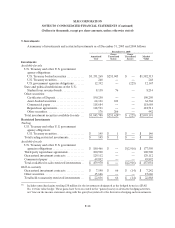
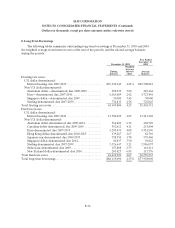
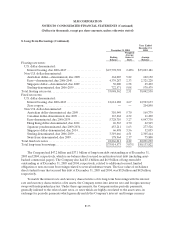
5. Investments
A summary of investments and restricted investments as of December 31, 2005 and 2004 follows:
December 31, 2005
Amortized
Cost
Gross
Unrealized
Gains
Gross
Unrealized
Losses
Market
Value
Investments
A
vailable-for-sale
U.S. Treasury and other U.S. government
agency obligations:
U.S.Treasurybackedsecurities............. $ 1,331,268 $ 251,045 $ — $ 1,582,313
U.S.Treasurysecurities.................... 248 — — 248
U.S. government agencies obligations........ 12,392 — (225) 12,167
State and political subdivisions of the U.S.:
Student loan revenuebonds................ 8,138 76 — 8,214
Other securities:
Certificates of Deposit..................... 190,250 — — 190,250
Asset-backedsecurities.................... 64,121 241 — 64,362
Commercial paper ........................ 118,684 — — 118,684
Repurchaseagreements.................... 118,511 — — 118,511
Othersecurities........................... 176 266 — 442
Total investment securities available-for-sale . . . $1,843,788 $251,628(1) $ (225 ) $ 2,095,191
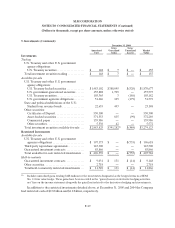
Restricted Investments
Trading
U.S. Treasury and other U.S. government
agency obligations:
U.S.Treasurysecurities.................... $ 145 $ 1 $ — $ 146
Total tradingrestricted investments ........... $ 145 $ 1 $ — $ 146
A
vailable-for sale
U.S. Treasury and other U.S. government
agenciesobligations....................... $ 180,466 $ — $ (2,916) $ 177,550
Third party repurchase agreements............ 100,500 — — 100,500
Guaranteed investment contracts ............. 129,112 — — 129,112
Commercial paper .......................... 49,892 — — 49,892
Total available-for-sale restricted investments . . $ 459,970 $ — $ (2,916) $ 457,054
Held-to-maturity
Guaranteed investment contracts ............. $ 7,190 $ 66 $ (14) $ 7,242
Othersecurities............................. 15,646 — — 15,646
Total held-to-maturity restricted investments . . . $ 22,836 $ 66 $ (14) $ 22,888
(1) Includes unrealized gains totaling $38 million for the investments designated as the hedged items in a SFAS
No. 133 fair value hedge. These gains have been recorded in the “gains (losses) on derivative hedging activities,
net” line on the income statement along with the gain (loss) related to the derivatives hedging such investments.