Sallie Mae 2005 Annual Report Download - page 51
Download and view the complete annual report
Please find page 51 of the 2005 Sallie Mae annual report below. You can navigate through the pages in the report by either clicking on the pages listed below, or by using the keyword search tool below to find specific information within the annual report.-
 1
1 -
2
-
3
-
4
-
5
-
6
-
7
-
8
-
9
-
10
-
11
-
12
-
13
-
14
-
15
-
16
-
17
-
18
-
19
-
20
-
21
-
22
-
23
-
24
-
25
-
26
-
27
-
28
-
29
-
30
-
31
-
32
-
33
-
34
-
35
-
36
-
37
-
38
-
39
-
40
-
 41
41 -
 42
42 -
 43
43 -
 44
44 -
 45
45 -
 46
46 -
 47
47 -
 48
48 -
 49
49 -
 50
50 -
 51
51 -
 52
52 -
 53
53 -
 54
54 -
 55
55 -
 56
56 -
 57
57 -
 58
58 -
 59
59 -
 60
60 -
 61
61 -
62
-
63
-
64
-
65
-
66
-
67
-
68
-
69
-
70
-
71
-
72
-
73
-
74
-
75
-
76
-
77
-
78
-
79
-
80
-
81
-
82
-
83
-
84
-
85
-
86
-
87
-
88
-
89
-
90
-
91
-
92
-
93
-
94
-
95
-
96
-
97
-
98
-
99
-
100
-
101
-
102
-
103
-
104
-
105
-
106
-
107
-
108
-
109
-
110
-
111
-
112
-
113
-
114
-
115
-
116
-
117
-
118
-
119
-
120
-
121
-
122
-
123
-
124
-
125
-
126
-
127
-
128
-
129
-
130
-
131
-
132
-
133
-
134
-
135
-
136
-
137
-
138
-
139
-
140
-
141
-
142
-
143
-
144
-
145
-
146
-
147
-
148
-
149
-
150
-
151
-
152
-
153
-
154
-
155
-
156
-
157
-
158
-
159
-
160
-
161
-
162
-
163
-
164
-
165
-
166
-
167
-
168
-
169
-
170
-
171
-
172
-
173
-
174
-
175
-
176
-
177
-
178
-
179
-
180
-
181
-
182
-
183
-
184
-
185
-
186
-
187
-
188
-
189
-
190
-
191
-
192
-
193
-
194
-
195
-
196
-
197
-
198
-
199
-
200
-
201
-
202
-
203
-
204
-
205
-
206
-
207
-
208
-
209
-
210
-
211
-
212
-
213
-
214
 |
 |
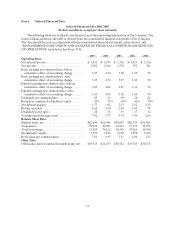
41
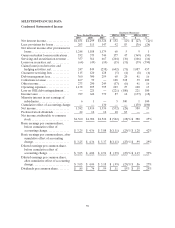
2004. On a pre-tax basis, income for the year ended December 31, 2005 decreased by 19 percent to
$2.1 billion versus $2.6 billion in the year ended December 31, 2004. The larger percentage decrease in net
income versus pre-tax income from 2004 to 2005 is primarily due to the increase in the effective tax rate
from 25 percent in the year ended 2004 to 34 percent in the year ended 2005. Fluctuations in the effective
tax rate are driven by the permanent impact of the exclusion of the gains and losses on equity forward
contracts with respect to the Company’s stock for tax purposes. Under SFAS No. 150, “Accounting for
Certain Financial Instruments with Characteristics of both Liabilities and Equity,” we are required to mark
the equity forward contracts to market each quarter and recognize the change in their value in income.
Conversely, these unrealized gains and losses are not recognized on a tax basis. In the year ended 2005, we
recognized unrealized gains on our outstanding equity forward contracts of $121 million versus unrealized
gains of $759 million in the year ended 2004.
The decrease in pre-tax income is primarily due to a $602 million decrease in the gain on derivative
and hedging activities, which primarily relates to derivatives that do not receive hedge accounting
treatment. Unrealized derivative gains and losses are primarily driven by the effect of changes in the fair
market value of Floor Income Contracts and the effect of an increase in the value of our stock price on
equity forward contracts. The smaller unrealized gains on our Floor Income Contracts in 2005 were due to
fewer contracts being in the money to the counterparty due to spot interest rates, and to a smaller rise in
forward interest rates in 2005 versus 2004. Our stock price increased in both 2005 and 2004, but the
absolute increase was less in 2005 resulting in a smaller unrealized gain on our equity forward contracts in
2005.
The year-over-year decrease in servicing and securitization revenue was due primarily to impairment
of our Retained Interests in securitizations of $260 million in 2005 versus $80 million in 2004. These
impairments are largely driven by the continued rise in Consolidation Loan activity. The increase in
impairment losses was partially offset by an increase in securitization gains of $177 million primarily caused
by higher percentage gains on the 2005 Private Education Loan securitizations.
The year-over-year increase in debt management fees and collections revenue of $188 million is
primarily due to a full year impact of collections revenue from AFS, acquired in the third quarter of 2004,
and overall growth in the contingency fee businesses. Positive impacts to pre-tax income were offset by the
year-over-year increase in operating expenses of $243 million, primarily attributable to the expenses
associated with three subsidiaries acquired in the second half of 2004: AFS, Southwest Student Services
Corporation (“Southwest”) and Student Loan Finance Association (“SLFA”).
Net income for the year ended December 31, 2004 was also negatively impacted by a $221 million pre-
tax loss related to the repurchase and defeasance of $3.0 billion of GSE debt in connection with the GSE
Wind-Down in 2004.
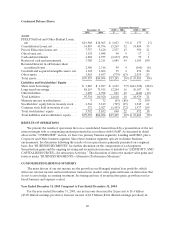
Our Managed student loan portfolio grew by $15.1 billion, from $107.4 billion at December 31, 2004
to $122.5 billion at December 31, 2005. This growth was fueled by the acquisition of $30.2 billion of student
loans in the year ended 2005, a 27 percent increase over the $23.7 billion acquired in 2004, exclusive of
student loans acquired from the acquisition of Southwest and SLFA. In the year ended 2005, we originated
$21.4 billion of student loans through our Preferred Channel, an increase of 19 percent over the
$18.0 billion originated in the year ended 2004.
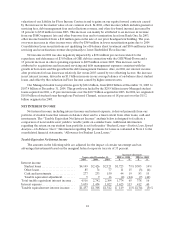
Year Ended December 31, 2004 Compared to Year Ended December 31, 2003
For the year ended December 31, 2004, our net income was $1.9 billion ($4.04 diluted earnings per
share) versus net income of $1.5 billion ($3.18 diluted earnings per share) in 2003. The increase in net
income from 2003 to 2004 is due to several factors. The principal driver of the growth in net income was a
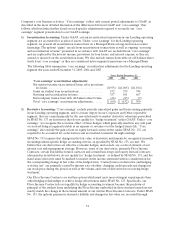
$1.1 billion pre-tax increase in the derivative market value adjustment. The derivative market value gain
can primarily be attributed to the positive effect that the increase in forward interest rates had on the