Sallie Mae 2005 Annual Report Download - page 114
Download and view the complete annual report
Please find page 114 of the 2005 Sallie Mae annual report below. You can navigate through the pages in the report by either clicking on the pages listed below, or by using the keyword search tool below to find specific information within the annual report.-
 1
1 -
2
-
3
-
4
-
5
-
6
-
7
-
8
-
9
-
10
-
11
-
12
-
13
-
14
-
15
-
16
-
17
-
18
-
19
-
20
-
21
-
22
-
23
-
24
-
25
-
26
-
27
-
28
-
29
-
30
-
31
-
32
-
33
-
34
-
35
-
36
-
37
-
38
-
39
-
40
-
41
-
42
-
43
-
44
-
45
-
46
-
47
-
48
-
49
-
50
-
51
-
52
-
53
-
54
-
55
-
56
-
57
-
58
-
59
-
60
-
61
-
62
-
63
-
64
-
65
-
66
-
67
-
68
-
69
-
70
-
71
-
72
-
73
-
74
-
75
-
76
-
77
-
78
-
79
-
80
-
81
-
82
-
83
-
84
-
85
-
86
-
87
-
88
-
89
-
90
-
91
-
92
-
93
-
94
-
95
-
96
-
97
-
98
-
99
-
100
-
101
-
102
-
103
-
 104
104 -
 105
105 -
 106
106 -
 107
107 -
 108
108 -
 109
109 -
 110
110 -
 111
111 -
 112
112 -
 113
113 -
 114
114 -
 115
115 -
 116
116 -
 117
117 -
 118
118 -
 119
119 -
 120
120 -
 121
121 -
 122
122 -
 123
123 -
 124
124 -
125
-
126
-
127
-
128
-
129
-
130
-
131
-
132
-
133
-
134
-
135
-
136
-
137
-
138
-
139
-
140
-
141
-
142
-
143
-
144
-
145
-
146
-
147
-
148
-
149
-
150
-
151
-
152
-
153
-
154
-
155
-
156
-
157
-
158
-
159
-
160
-
161
-
162
-
163
-
164
-
165
-
166
-
167
-
168
-
169
-
170
-
171
-
172
-
173
-
174
-
175
-
176
-
177
-
178
-
179
-
180
-
181
-
182
-
183
-
184
-
185
-
186
-
187
-
188
-
189
-
190
-
191
-
192
-
193
-
194
-
195
-
196
-
197
-
198
-
199
-
200
-
201
-
202
-
203
-
204
-
205
-
206
-
207
-
208
-
209
-
210
-
211
-
212
-
213
-
214
 |
 |

104
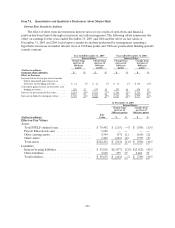
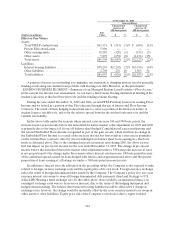
At December 31, 2004
Interest Rates:
Change from
increase of
100 basis points
Change from
increase of
300 basis points
(Dollars in millions)
Fair
Value $ % $ %
Effect on Fair Values
Assets
Total FFELPstudent loans......................... $61,531 $ (315) (1)% $ (636) (1)%
Private Education Loans........................... 5,900 — — — —
Other earning assets............................... 10,285 (120) (1) (333) (3)
Other assets...................................... 7,878 (652) (8) (1,154) (15)
Total assets....................................... $85,594 $ (1,087) (1)% $ (2,123) (2)%
Liabilities
Interest bearing liabilities .......................... $78,295 $ (1,202) (2)% $ (3,356) (4)%
Other liabilities................................... 2,798 276 10 1,503 54
Total liabilities.................................... $81,093 $ (926) (1)% $ (1,853) (2)%
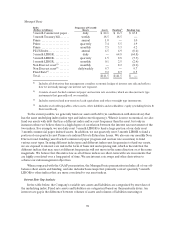
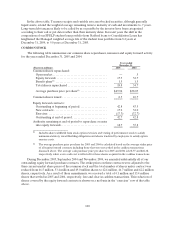
A primary objective in our funding is to minimize our sensitivity to changing interest rates by generally
funding our floating rate student loan portfolio with floating rate debt. However, as discussed under
“LENDING BUSINESS SEGMENT—Summary of our Managed Student Loan Portfolio—Floor Income,”
in the current low interest rate environment, we can have a fixed versus floating mismatch in funding if the
student loan earns at the fixed borrower rate and the funding remains floating.
During the year ended December 31, 2005 and 2004, certain FFELP student loans were earning Floor
Income and we locked in a portion of that Floor Income through the use of futures and Floor Income
Contracts. The result of these hedging transactions was to convert a portion of the fixed rate nature of
student loans to variable rate, and to fix the relative spread between the student loan asset rate and the
variable rate liability.
In the above table under the scenario where interest rates increase 100 and 300 basis points, the
increase in pre-tax net income before the unrealized derivative market value adjustment for 2005 and 2004
is primarily due to the impact of (i) our off-balance sheet hedged Consolidation Loan securitizations and
the related Embedded Floor Income recognized as part of the gain on sale, which results in no change in
the Embedded Floor Income as a result of the increase in rates but does result in a decrease in payments
on the written Floor contracts; offset by (ii) our unhedged on-balance sheet loans earning in a fixed rate
mode as discussed above. Due to the continued increase in interest rates during 2005, the above factors
had less impact on pre-tax net income for the year ended December 31, 2005. The change in pre-tax net
income before the unrealized derivative market value adjustment under a 300 basis point increase in rates
is not proportional to the change under the scenario where interest rates increase 100 basis points because
of the additional spread earned on loans hedged with futures and swaps mentioned above and the greater
proportion of loans earning at a floating rate under a 300 basis point increase in rates.
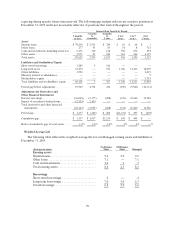
In addition to interest rate risk addressed in the preceding tables, the Company is also exposed to risks
related to foreign currency exchange rates and the equity price of its own stock. Foreign currency exchange
risk is the result of foreign denominated debt issued by the Company. The Company’s policy is to use cross
currency interest rate swaps to swap all foreign denominated debt payments (fixed and floating) to U.S.
dollar LIBOR using a fixed exchange rate. In the tables above, there would be an immaterial impact on
earnings if exchange rates were to decrease or increase, due to the terms of the hedging instrument and
hedged items matching. The balance sheet interest bearing liabilities would be affected by a change in
exchange rates, however, the change would be materially offset by the cross currency interest rate swaps in
other assets or other liabilities. Equity price risk of the Company’s own stock is due to equity forward