Sallie Mae 2005 Annual Report Download - page 53
Download and view the complete annual report
Please find page 53 of the 2005 Sallie Mae annual report below. You can navigate through the pages in the report by either clicking on the pages listed below, or by using the keyword search tool below to find specific information within the annual report.-
 1
1 -
2
-
3
-
4
-
5
-
6
-
7
-
8
-
9
-
10
-
11
-
12
-
13
-
14
-
15
-
16
-
17
-
18
-
19
-
20
-
21
-
22
-
23
-
24
-
25
-
26
-
27
-
28
-
29
-
30
-
31
-
32
-
33
-
34
-
35
-
36
-
37
-
38
-
39
-
40
-
41
-
42
-
 43
43 -
 44
44 -
 45
45 -
 46
46 -
 47
47 -
 48
48 -
 49
49 -
 50
50 -
 51
51 -
 52
52 -
 53
53 -
 54
54 -
 55
55 -
 56
56 -
 57
57 -
 58
58 -
 59
59 -
 60
60 -
 61
61 -
 62
62 -
 63
63 -
64
-
65
-
66
-
67
-
68
-
69
-
70
-
71
-
72
-
73
-
74
-
75
-
76
-
77
-
78
-
79
-
80
-
81
-
82
-
83
-
84
-
85
-
86
-
87
-
88
-
89
-
90
-
91
-
92
-
93
-
94
-
95
-
96
-
97
-
98
-
99
-
100
-
101
-
102
-
103
-
104
-
105
-
106
-
107
-
108
-
109
-
110
-
111
-
112
-
113
-
114
-
115
-
116
-
117
-
118
-
119
-
120
-
121
-
122
-
123
-
124
-
125
-
126
-
127
-
128
-
129
-
130
-
131
-
132
-
133
-
134
-
135
-
136
-
137
-
138
-
139
-
140
-
141
-
142
-
143
-
144
-
145
-
146
-
147
-
148
-
149
-
150
-
151
-
152
-
153
-
154
-
155
-
156
-
157
-
158
-
159
-
160
-
161
-
162
-
163
-
164
-
165
-
166
-
167
-
168
-
169
-
170
-
171
-
172
-
173
-
174
-
175
-
176
-
177
-
178
-
179
-
180
-
181
-
182
-
183
-
184
-
185
-
186
-
187
-
188
-
189
-
190
-
191
-
192
-
193
-
194
-
195
-
196
-
197
-
198
-
199
-
200
-
201
-
202
-
203
-
204
-
205
-
206
-
207
-
208
-
209
-
210
-
211
-
212
-
213
-
214
 |
 |

43
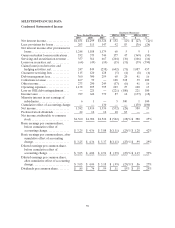
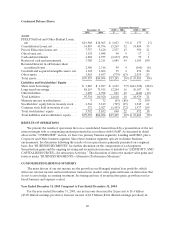
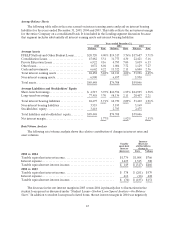
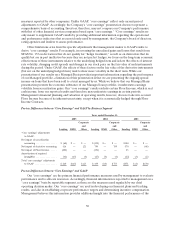
Average Balance Sheets
The following table reflects the rates earned on interest earning assets and paid on interest bearing
liabilities for the years ended December 31, 2005, 2004 and 2003. This table reflects the net interest margin
for the entire Company on a consolidated basis. It is included in the Lending segment discussion because
that segment includes substantially all interest earning assets and interest bearing liabilities.
Years ended December 31,
2005 2004 2003
Balance Rate Balance Rate Balance Rate
Average Assets
FFELP Stafford and Other Student Loans....... $20,720 4.90%$19,317 3.76%$17,687 3.71%
ConsolidationLoans.......................... 47,082 5.31 31,773 4.30 22,421 5.16
PrivateEducationLoans...................... 6,922 9.16 4,795 7.00 5,019 6.13
Otherloans.................................. 1,072 8.04 1,004 7.72 1,129 7.27
Cashandinvestments......................... 6,662 4.22 11,322 2.11 6,840 2.36
Total interestearning assets................... 82,458 5.48% 68,211 4.02% 53,096 4.45%
Non-interestearningassets.................... 6,990 6,497 5,950
Totalassets.................................. $89,448 $74,708 $59,046
Average Liabilities and Stockholders’ Equity
Short-term borrowings ........................ $ 4,517 3.93%$10,596 1.95%$24,995 1.58%
Long-term borrowings ........................ 77,958 3.70 58,134 2.11 28,407 2.21
Total interestbearing liabilities ................ 82,475 3.71% 68,730 2.09% 53,402 1.91%
Non-interestbearingliabilities................. 3,555 3,195 3,169
Stockholders’equity.......................... 3,418 2,783 2,475
Total liabilities andstockholders’ equity......... $89,448 $74,708 $59,046
Netinterestmargin........................... 1.77% 1.92% 2.53%
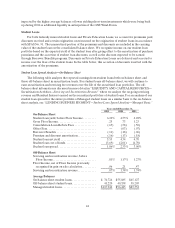
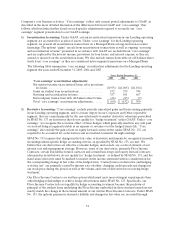
Rate/Volume Analysis
The following rate/volume analysis shows the relative contribution of changes in interest rates and
asset volumes.
Taxable
equivalent
increase
Increase
(decrease)
attributable to
change in
(decrease) Rate Volume
2005 vs. 2004
Taxable equivalent interest income................................... $1,774 $ 1,008 $ 766
Interest expense.................................................... 1,625 1,325 300
Taxable equivalent net interest income................................ $ 149 $ (317) $ 466
2004 vs. 2003
Taxable equivalent interest income................................... $ 378 $ (201) $ 579
Interest expense.................................................... 412 (16) 428
Taxable equivalent net interest income................................ $ (34) $ (185) $ 151
The decrease in the net interest margin in 2005 versus 2004 is primarily due to fluctuations in the
student loan spread as discussed under “Student Loans—Student Loan Spread Analysis—On-Balance
Sheet.” In addition to student loan spread related items, the net interest margin in 2004 was negatively