Sallie Mae 2005 Annual Report Download - page 10
Download and view the complete annual report
Please find page 10 of the 2005 Sallie Mae annual report below. You can navigate through the pages in the report by either clicking on the pages listed below, or by using the keyword search tool below to find specific information within the annual report.-
 1
1 -
 2
2 -
 3
3 -
 4
4 -
 5
5 -
 6
6 -
 7
7 -
 8
8 -
 9
9 -
 10
10 -
 11
11 -
 12
12 -
 13
13 -
 14
14 -
 15
15 -
 16
16 -
 17
17 -
 18
18 -
 19
19 -
 20
20 -
 21
21 -
22
-
23
-
24
-
25
-
26
-
27
-
28
-
29
-
30
-
31
-
32
-
33
-
34
-
35
-
36
-
37
-
38
-
39
-
40
-
41
-
42
-
43
-
44
-
45
-
46
-
47
-
48
-
49
-
50
-
51
-
52
-
53
-
54
-
55
-
56
-
57
-
58
-
59
-
60
-
61
-
62
-
63
-
64
-
65
-
66
-
67
-
68
-
69
-
70
-
71
-
72
-
73
-
74
-
75
-
76
-
77
-
78
-
79
-
80
-
81
-
82
-
83
-
84
-
85
-
86
-
87
-
88
-
89
-
90
-
91
-
92
-
93
-
94
-
95
-
96
-
97
-
98
-
99
-
100
-
101
-
102
-
103
-
104
-
105
-
106
-
107
-
108
-
109
-
110
-
111
-
112
-
113
-
114
-
115
-
116
-
117
-
118
-
119
-
120
-
121
-
122
-
123
-
124
-
125
-
126
-
127
-
128
-
129
-
130
-
131
-
132
-
133
-
134
-
135
-
136
-
137
-
138
-
139
-
140
-
141
-
142
-
143
-
144
-
145
-
146
-
147
-
148
-
149
-
150
-
151
-
152
-
153
-
154
-
155
-
156
-
157
-
158
-
159
-
160
-
161
-
162
-
163
-
164
-
165
-
166
-
167
-
168
-
169
-
170
-
171
-
172
-
173
-
174
-
175
-
176
-
177
-
178
-
179
-
180
-
181
-
182
-
183
-
184
-
185
-
186
-
187
-
188
-
189
-
190
-
191
-
192
-
193
-
194
-
195
-
196
-
197
-
198
-
199
-
200
-
201
-
202
-
203
-
204
-
205
-
206
-
207
-
208
-
209
-
210
-
211
-
212
-
213
-
214
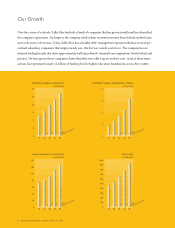
 |
 |

ENDING MANAGED STUDENT LOANS
($ IN BILLIONS)
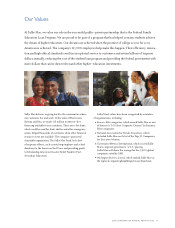
Our Growth
01 02 03 04 05
Over the course of a decade, Sallie Mae has built a family of companies that has grown steadily and has diversified
the company’s operations. No longer is the company solely reliant on interest income from federal student loans
as its sole source of revenue. Today, Sallie Mae has a healthy debt-management operation that has several spe-
cialized subsidiary companies that employ nearly one-third of our overall work force. The company has six
internal lending brands that drive approximately half of preferred-channel loan originations (both federal and
private). We have grown these companies faster than they were able to grow on their own. In total, these trans-
actions have generated nearly $2 billion of funding for five higher education foundations across the country.
FEE INCOME
($ IN MILLIONS)
01 02 03 04 05
01 02 03 04 05
8SLM CORPORATION ANNUAL REPORT 2005
PREFERRED CHANNEL ORIGINATIONS
($ IN BILLIONS)
01 02 03 04 05
PREFERRED CHANNEL ORIGINATIONS —PRIVATE
($ IN BILLIONS)
4
16
12
8
20
24
0
0 0
100
200
300
400
500
600
700
800
900
1000
20
40
60
80
100
120
140
0
2
4
6
8