Sallie Mae 2005 Annual Report Download - page 81
Download and view the complete annual report
Please find page 81 of the 2005 Sallie Mae annual report below. You can navigate through the pages in the report by either clicking on the pages listed below, or by using the keyword search tool below to find specific information within the annual report.-
 1
1 -
2
-
3
-
4
-
5
-
6
-
7
-
8
-
9
-
10
-
11
-
12
-
13
-
14
-
15
-
16
-
17
-
18
-
19
-
20
-
21
-
22
-
23
-
24
-
25
-
26
-
27
-
28
-
29
-
30
-
31
-
32
-
33
-
34
-
35
-
36
-
37
-
38
-
39
-
40
-
41
-
42
-
43
-
44
-
45
-
46
-
47
-
48
-
49
-
50
-
51
-
52
-
53
-
54
-
55
-
56
-
57
-
58
-
59
-
60
-
61
-
62
-
63
-
64
-
65
-
66
-
67
-
68
-
69
-
70
-
 71
71 -
 72
72 -
 73
73 -
 74
74 -
 75
75 -
 76
76 -
 77
77 -
 78
78 -
 79
79 -
 80
80 -
 81
81 -
 82
82 -
 83
83 -
 84
84 -
 85
85 -
 86
86 -
 87
87 -
 88
88 -
 89
89 -
 90
90 -
 91
91 -
92
-
93
-
94
-
95
-
96
-
97
-
98
-
99
-
100
-
101
-
102
-
103
-
104
-
105
-
106
-
107
-
108
-
109
-
110
-
111
-
112
-
113
-
114
-
115
-
116
-
117
-
118
-
119
-
120
-
121
-
122
-
123
-
124
-
125
-
126
-
127
-
128
-
129
-
130
-
131
-
132
-
133
-
134
-
135
-
136
-
137
-
138
-
139
-
140
-
141
-
142
-
143
-
144
-
145
-
146
-
147
-
148
-
149
-
150
-
151
-
152
-
153
-
154
-
155
-
156
-
157
-
158
-
159
-
160
-
161
-
162
-
163
-
164
-
165
-
166
-
167
-
168
-
169
-
170
-
171
-
172
-
173
-
174
-
175
-
176
-
177
-
178
-
179
-
180
-
181
-
182
-
183
-
184
-
185
-
186
-
187
-
188
-
189
-
190
-
191
-
192
-
193
-
194
-
195
-
196
-
197
-
198
-
199
-
200
-
201
-
202
-
203
-
204
-
205
-
206
-
207
-
208
-
209
-
210
-
211
-
212
-
213
-
214
 |
 |

71
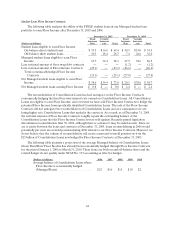
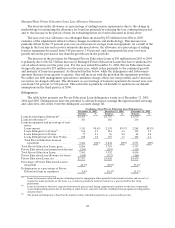
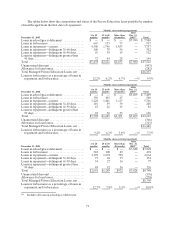
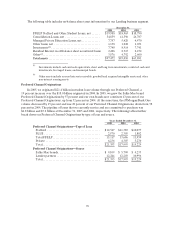
The tables below show the composition and status of the Private Education Loan portfolio by number
of months aged from the first date of repayment:
Months since entering repayment
December 31, 2005
1 to 24
months
25 to 48
months
More than
48 months
After
Dec. 31,
2005(1) Total
Loans in-school/grace/deferment ................ $ — $ — $ — $7,980 $ 7,980
Loansinforbearance .......................... 667 173 77 — 917
Loansinrepayment—current................... 4,508 1,796 1,453 — 7,757
Loansin repayment—delinquent 31-60 days...... 168 78 56 — 302
Loansin repayment—delinquent 61-90 days...... 63 30 19 — 112
Loans in repayment—delinquent greater than
90days..................................... 72 44 28 — 144
Total ........................................ $ 5,478 $ 2,121 $ 1,633 $ 7,980 $ 17,212
Unamortizeddiscount ......................... (493)
Allowance for loan losses....................... (282)
Total Managed Private Education Loans,net..... $ 16,437
Loans in forbearance as a percentage of loans in
repayment and forbearance................... 12.2% 8.2% 4.7% —% 9.9%
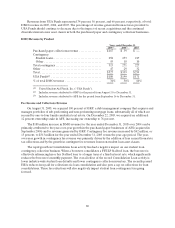
Months since entering repayment
December 31, 2004
1 to 24
months
25 to 48
months
More than
48 months
After
Dec. 31,
2004(1) Total
Loans in-school/grace/deferment ................ $ — $ — $ — $5,409 $ 5,409
Loansinforbearance .......................... 350 103 47 — 500
Loansinrepayment—current................... 3,228 1,401 1,117 — 5,746
Loansin repayment—delinquent 31-60 days...... 110 59 39 — 208
Loansin repayment—delinquent 61-90 days...... 43 26 15 — 84
Loans in repayment—delinquent greater than
90days..................................... 67 56 33 — 156
Total ........................................ $ 3,798 $ 1,645 $ 1,251 $ 5,409 $ 12,103
Unamortizeddiscount ......................... (306)
Allowance for loan losses....................... (315)
Total Managed Private Education Loans,net..... $ 11,482
Loans in forbearance as a percentage of loans in
repayment and forbearance................... 9.2% 6.3% 3.8% —% 7.5%
Months since entering repayment
December 31, 2003
1 to 24
months
25 to 48
months
More than
48 months
After
Dec. 31,
2003(1) Total
Loans in-school/grace/deferment ................ $ — $ — $ — $3,828 $ 3,828
Loans inforbearance .......................... 342 100 49 — 491
Loans inrepayment—current................... 2,192 1,074 798 — 4,064
Loansin repayment—delinquent 31-60 days...... 75 46 33 — 154
Loansin repayment—delinquent 61-90 days...... 34 27 16 — 77
Loans in repayment—delinquent greater than
90days..................................... 48 42 36 — 126
Total ........................................ $ 2,691 $ 1,289 $ 932 $ 3,828 $ 8,740
Unamortizeddiscount ......................... (176)
Allowance for loan losses....................... (259)
Total Managed Private Education Loans,net..... $ 8,305
Loans in forbearance as a percentage of loans in
repayment and forbearance................... 12.7% 7.8% 5.3% —% 10.0%
(1) Includes all loans in-school/grace/deferment.