Sallie Mae 2005 Annual Report Download - page 93
Download and view the complete annual report
Please find page 93 of the 2005 Sallie Mae annual report below. You can navigate through the pages in the report by either clicking on the pages listed below, or by using the keyword search tool below to find specific information within the annual report.-
 1
1 -
2
-
3
-
4
-
5
-
6
-
7
-
8
-
9
-
10
-
11
-
12
-
13
-
14
-
15
-
16
-
17
-
18
-
19
-
20
-
21
-
22
-
23
-
24
-
25
-
26
-
27
-
28
-
29
-
30
-
31
-
32
-
33
-
34
-
35
-
36
-
37
-
38
-
39
-
40
-
41
-
42
-
43
-
44
-
45
-
46
-
47
-
48
-
49
-
50
-
51
-
52
-
53
-
54
-
55
-
56
-
57
-
58
-
59
-
60
-
61
-
62
-
63
-
64
-
65
-
66
-
67
-
68
-
69
-
70
-
71
-
72
-
73
-
74
-
75
-
76
-
77
-
78
-
79
-
80
-
81
-
82
-
 83
83 -
 84
84 -
 85
85 -
 86
86 -
 87
87 -
 88
88 -
 89
89 -
 90
90 -
 91
91 -
 92
92 -
 93
93 -
 94
94 -
 95
95 -
 96
96 -
 97
97 -
 98
98 -
 99
99 -
 100
100 -
 101
101 -
 102
102 -
 103
103 -
104
-
105
-
106
-
107
-
108
-
109
-
110
-
111
-
112
-
113
-
114
-
115
-
116
-
117
-
118
-
119
-
120
-
121
-
122
-
123
-
124
-
125
-
126
-
127
-
128
-
129
-
130
-
131
-
132
-
133
-
134
-
135
-
136
-
137
-
138
-
139
-
140
-
141
-
142
-
143
-
144
-
145
-
146
-
147
-
148
-
149
-
150
-
151
-
152
-
153
-
154
-
155
-
156
-
157
-
158
-
159
-
160
-
161
-
162
-
163
-
164
-
165
-
166
-
167
-
168
-
169
-
170
-
171
-
172
-
173
-
174
-
175
-
176
-
177
-
178
-
179
-
180
-
181
-
182
-
183
-
184
-
185
-
186
-
187
-
188
-
189
-
190
-
191
-
192
-
193
-
194
-
195
-
196
-
197
-
198
-
199
-
200
-
201
-
202
-
203
-
204
-
205
-
206
-
207
-
208
-
209
-
210
-
211
-
212
-
213
-
214
 |
 |

83
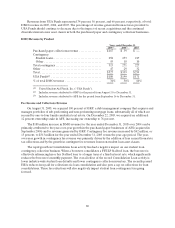
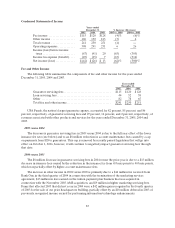
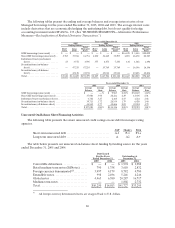
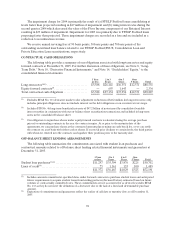
Condensed Statements of Income
Years ended
December 31, % Increase (Decrease)
2005 2004 2003 2005 vs. 2004 2004 vs. 2003
Feeincome ................... $ 115 $ 120 $ 128 (4)% (6)%
Otherincome ................. 126 130 123 (3) 6
Totalrevenue ................. 241 250 251 (4) —
Operatingexpenses ............ 308 291 231 6 26
Income (loss) before income
taxes ....................... (67) (41) 20 (63) (305)
Income tax expense (benefit).... (25) (15) 7 (67) (314)
Net income (loss) .............. $(42) $(26) $ 13 (62)% (300)%
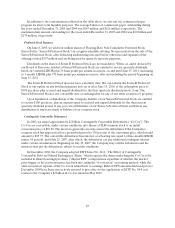
Fee and Other Income
The following table summarizes the components of fee and other income for the years ended
December 31, 2005, 2004 and 2003.
Years ended
December 31,
2005 2004 2003
Guarantorservicingfees.................................. $115 $120 $128
Loan servicing fees....................................... 44 52 58
Other .................................................. 82 78 65
Total fee andother income................................ $241 $250 $251
USA Funds, the nation’s largest guarantee agency, accounted for 82 percent, 85 percent, and 86
percent, respectively, of guarantor servicing fees and 27 percent, 16 percent, and 2 percent, respectively, of
revenues associated with other products and services for the years ended December 31, 2005, 2004 and
2003.
2005 versus 2004
The decrease is guarantor servicing fees in 2005 versus 2004 is due to the full year effect of the lower
issuance fee rate (see below) and to an $8 million reduction in account maintenance fees caused by a cap
on payments from ED to guarantors. This cap is removed by recently passed legislation that will go into
effect on October 1, 2006, however, it will continue to negatively impact guarantor servicing fees through
that date.
2004 versus 2003
The $8 million decrease in guarantor servicing fees in 2004 versus the prior year is due to a $13 million
decrease in issuance fees caused by the reduction in the issuance fee from 65 basis points to 40 basis points,
which was partially offset by higher account maintenance fees.
The increase in other income in 2004 versus 2003 is primarily due to a $14 million fee received from
Bank One in the third quarter of 2004 in connection with the termination of the marketing services
agreement, $13 million in fees earned on the tuition payment plan business that was acquired in
connection with the November 2003 AMS acquisition, and $9 million in higher marketing servicing fees.
Items that affected 2003 that did not recur in 2004 were a $42 million gain recognized in the fourth quarter
of 2003 for the sale of our prior headquarters building, partially offset by an $18 million deferral in 2003 of
previously recognized income earned for performing information technology enhancements.