Sallie Mae 2005 Annual Report Download - page 49
Download and view the complete annual report
Please find page 49 of the 2005 Sallie Mae annual report below. You can navigate through the pages in the report by either clicking on the pages listed below, or by using the keyword search tool below to find specific information within the annual report.-
 1
1 -
2
-
3
-
4
-
5
-
6
-
7
-
8
-
9
-
10
-
11
-
12
-
13
-
14
-
15
-
16
-
17
-
18
-
19
-
20
-
21
-
22
-
23
-
24
-
25
-
26
-
27
-
28
-
29
-
30
-
31
-
32
-
33
-
34
-
35
-
36
-
37
-
38
-
 39
39 -
 40
40 -
 41
41 -
 42
42 -
 43
43 -
 44
44 -
 45
45 -
 46
46 -
 47
47 -
 48
48 -
 49
49 -
 50
50 -
 51
51 -
 52
52 -
 53
53 -
 54
54 -
 55
55 -
 56
56 -
 57
57 -
 58
58 -
 59
59 -
60
-
61
-
62
-
63
-
64
-
65
-
66
-
67
-
68
-
69
-
70
-
71
-
72
-
73
-
74
-
75
-
76
-
77
-
78
-
79
-
80
-
81
-
82
-
83
-
84
-
85
-
86
-
87
-
88
-
89
-
90
-
91
-
92
-
93
-
94
-
95
-
96
-
97
-
98
-
99
-
100
-
101
-
102
-
103
-
104
-
105
-
106
-
107
-
108
-
109
-
110
-
111
-
112
-
113
-
114
-
115
-
116
-
117
-
118
-
119
-
120
-
121
-
122
-
123
-
124
-
125
-
126
-
127
-
128
-
129
-
130
-
131
-
132
-
133
-
134
-
135
-
136
-
137
-
138
-
139
-
140
-
141
-
142
-
143
-
144
-
145
-
146
-
147
-
148
-
149
-
150
-
151
-
152
-
153
-
154
-
155
-
156
-
157
-
158
-
159
-
160
-
161
-
162
-
163
-
164
-
165
-
166
-
167
-
168
-
169
-
170
-
171
-
172
-
173
-
174
-
175
-
176
-
177
-
178
-
179
-
180
-
181
-
182
-
183
-
184
-
185
-
186
-
187
-
188
-
189
-
190
-
191
-
192
-
193
-
194
-
195
-
196
-
197
-
198
-
199
-
200
-
201
-
202
-
203
-
204
-
205
-
206
-
207
-
208
-
209
-
210
-
211
-
212
-
213
-
214
 |
 |

39
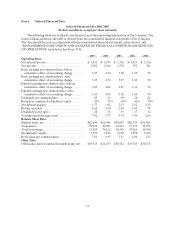
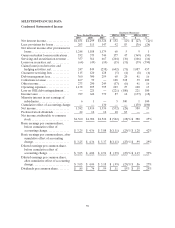
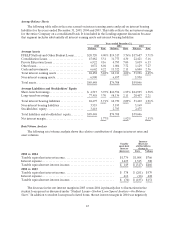
SELECTED FINANCIAL DATA
Condensed Statements of Income
Increase (Decrease)
Years Ended December 31, 2005 vs. 2004 2004 vs. 2003
2005 2004 2003 $ % $ %
Netinterestincome................. $1,451 $1,299 $1,326 $ 152 12% $ (27) (2)%
Less:provisionsforlosses ........... 203 111 147 92 83 (36) (24)
Net interest income after provisions for
losses........................... 1,248 1,188 1,179 60 5 9 1
Gains on student loan securitizations . 552 375 744 177 47 (369 ) (50)
Servicing and securitization revenue . . 357 561 667 (204) (36 ) (106 ) (16)
Losses onsecurities, net............. (64) (49) (10) (15) (31) (39) (390)
Gains (losses) on derivative and
hedging activities, net............. 247 849 (238) (602) (71) 1,087 457
Guarantorservicingfees ............ 115 120 128 (5) (4) (8) (6)
Debtmanagementfees.............. 360 300 259 60 20 41 16
Collections revenue ................ 167 39 — 128 328 39 100
Otherincome...................... 273 290 249 (17) (6) 41 16
Operatingexpenses................. 1,138 895 795 243 27 100 13
Loss on GSEdebt extinguishment.... — 221 — (221) (100) 221 100
Incometaxes ...................... 729 642 779 87 14 (137) (18)
Minority interest in net earnings of
subsidiaries...................... 6 1 — 5 500 1 100
Cumulative effect of accounting change — — 130 — — (130 ) (100)
Netincome........................ 1,382 1,914 1,534 (532) (28) 380 25
Preferredstockdividends ........... 22 12 12 10 83 — —
Net income attributable to common
stock ........................... $1,360 $1,902 $1,522 $ (542) (28 )% $ 380 25%
Basic earnings per common share,
before cumulative effect of
accounting change................ $ 3.25 $ 4.36 $ 3.08 $(1.11) (25)%$ 1.28 42%
Basic earnings per common share, after
cumulative effect of accounting
change.......................... $ 3.25 $ 4.36 $ 3.37 $(1.11) (25)%$ .99 29%
Diluted earnings per common share,
before cumulative effect of
accounting change................ $ 3.05 $ 4.04 $ 2.91 $ (.99) (25)%$ 1.13 39%
Diluted earnings per common share,
after cumulative effect of accounting
change.......................... $ 3.05 $ 4.04 $ 3.18 $ (.99) (25)%$ .86 27%
Dividendspercommonshare........ $ .85 $ .74 $ .59 $ .11 15% $ .15 25%