Sallie Mae 2005 Annual Report Download - page 128
Download and view the complete annual report
Please find page 128 of the 2005 Sallie Mae annual report below. You can navigate through the pages in the report by either clicking on the pages listed below, or by using the keyword search tool below to find specific information within the annual report.-
 1
1 -
2
-
3
-
4
-
5
-
6
-
7
-
8
-
9
-
10
-
11
-
12
-
13
-
14
-
15
-
16
-
17
-
18
-
19
-
20
-
21
-
22
-
23
-
24
-
25
-
26
-
27
-
28
-
29
-
30
-
31
-
32
-
33
-
34
-
35
-
36
-
37
-
38
-
39
-
40
-
41
-
42
-
43
-
44
-
45
-
46
-
47
-
48
-
49
-
50
-
51
-
52
-
53
-
54
-
55
-
56
-
57
-
58
-
59
-
60
-
61
-
62
-
63
-
64
-
65
-
66
-
67
-
68
-
69
-
70
-
71
-
72
-
73
-
74
-
75
-
76
-
77
-
78
-
79
-
80
-
81
-
82
-
83
-
84
-
85
-
86
-
87
-
88
-
89
-
90
-
91
-
92
-
93
-
94
-
95
-
96
-
97
-
98
-
99
-
100
-
101
-
102
-
103
-
104
-
105
-
106
-
107
-
108
-
109
-
110
-
111
-
112
-
113
-
114
-
115
-
116
-
117
-
 118
118 -
 119
119 -
 120
120 -
 121
121 -
 122
122 -
 123
123 -
 124
124 -
 125
125 -
 126
126 -
 127
127 -
 128
128 -
 129
129 -
 130
130 -
 131
131 -
 132
132 -
 133
133 -
 134
134 -
 135
135 -
 136
136 -
 137
137 -
 138
138 -
139
-
140
-
141
-
142
-
143
-
144
-
145
-
146
-
147
-
148
-
149
-
150
-
151
-
152
-
153
-
154
-
155
-
156
-
157
-
158
-
159
-
160
-
161
-
162
-
163
-
164
-
165
-
166
-
167
-
168
-
169
-
170
-
171
-
172
-
173
-
174
-
175
-
176
-
177
-
178
-
179
-
180
-
181
-
182
-
183
-
184
-
185
-
186
-
187
-
188
-
189
-
190
-
191
-
192
-
193
-
194
-
195
-
196
-
197
-
198
-
199
-
200
-
201
-
202
-
203
-
204
-
205
-
206
-
207
-
208
-
209
-
210
-
211
-
212
-
213
-
214
 |
 |

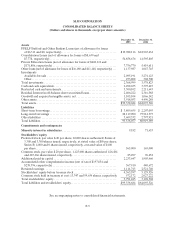
See accompanying notes to consolidated financial statements.
F-6
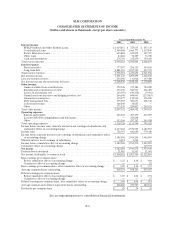
SLM CORPORATION
CONSOLIDATED STATEMENTS OF INCOME
(Dollars and shares in thousands, except per share amounts)
Years Ended December 31,
2005 2004 2003
Interest income:
FFELP Staffordand OtherStudent Loans................................. $1,014,851 $ 725,619 $ 655,519
Consolidation Loans.................................................. 2,500,008 1,364,777 1,157,849
Private Education Loans............................................... 633,884 335,451 307,477
Other loans ......................................................... 84,664 74,289 76,740
Cash and investments ................................................. 276,756 232,859 150,690
Total interest income ................................................... 4,510,163 2,732,995 2,348,275
Interest expense:
Short-term debt...................................................... 177,597 206,151 394,109
Long-term debt...................................................... 2,881,121 1,227,545 627,797
Total interest expense ................................................... 3,058,718 1,433,696 1,021,906
Net interest income ..................................................... 1,451,445 1,299,299 1,326,369
Less: provisions for losses ................................................ 203,006 111,066 147,480
Net interest income after provisions for losses................................ 1,248,439 1,188,233 1,178,889
Other income:
Gains on student loan securitizations ..................................... 552,546 375,384 744,289
Servicing and securitization revenue...................................... 356,730 560,971 666,409
Losses on investments, net ............................................. (63,955 ) (49,358 ) (9,932)
Gains (losses) on derivative and hedging activities, net ....................... 246,548 849,041 (237,815)
Guarantor servicing fees ............................................... 115,477 119,934 128,189
Debt management fees ................................................ 359,907 300,071 258,544
Collections revenue................................................... 166,840 38,687 —
Other.............................................................. 273,259 289,802 249,421
Total other income ..................................................... 2,007,352 2,484,532 1,799,105
Operating expenses:
Salaries and benefits.................................................. 625,024 497,170 432,007
Loss on GSE debt extinguishment and defeasance .......................... — 220,848 —
Other.............................................................. 513,304 397,762 363,018
Total operating expenses................................................. 1,138,328 1,115,780 795,025
Income before income taxes, minority interest in net earnings of subsidiaries and
cumulative effect of accounting change ................................... 2,117,
463 2,556,985 2,182,969
Income taxes.......................................................... 728,767 642,689 779,380
Income before minority interest in net earnings of subsidiaries and cumulative effect
of accounting change.................................................. 1,388,696 1,914,296 1,403,589
Minority interest in net earnings of subsidiaries .............................. 6,412 1,026 —
Income before cumulative effect of accounting change......................... 1,382,284 1,913,270 1,403,589
Cumulative effect of accounting change..................................... — — 129,971
Net income............................................................ 1,382,284 1,913,270 1,533,560
Preferred stock dividends ................................................ 21,903 11,501 11,501
Net income attributable to common stock ................................... $1,360,381 $ 1,901,769 $ 1,522,059
Basic earnings per common share:
Before cumulative effect of accounting change ............................. $ 3.25 $ 4.36 $ 3.08
Cumulative effect of accounting change................................... — — .29
Basic earnings per common share, after cumulative effect of accounting change .... $ 3.25 $
4.36 $ 3.37
Average common shares outstanding ....................................... 418,374 436,133 452,037
Diluted earnings per common share:
Before cumulative effect of accounting change ............................. $ 3.05 $ 4.04 $ 2.91
Cumulative effect of accounting change................................... — — .27
Diluted earnings per common share, after cumulative effect of accounting change. . . $ 3.05 $ 4.04 $ 3.18
Average common and common equivalent shares outstanding................... 460,260 475,787 482,104
Dividends per common share............................................. $ .85 $ .74 $ .59