Sallie Mae 2005 Annual Report Download - page 98
Download and view the complete annual report
Please find page 98 of the 2005 Sallie Mae annual report below. You can navigate through the pages in the report by either clicking on the pages listed below, or by using the keyword search tool below to find specific information within the annual report.-
 1
1 -
2
-
3
-
4
-
5
-
6
-
7
-
8
-
9
-
10
-
11
-
12
-
13
-
14
-
15
-
16
-
17
-
18
-
19
-
20
-
21
-
22
-
23
-
24
-
25
-
26
-
27
-
28
-
29
-
30
-
31
-
32
-
33
-
34
-
35
-
36
-
37
-
38
-
39
-
40
-
41
-
42
-
43
-
44
-
45
-
46
-
47
-
48
-
49
-
50
-
51
-
52
-
53
-
54
-
55
-
56
-
57
-
58
-
59
-
60
-
61
-
62
-
63
-
64
-
65
-
66
-
67
-
68
-
69
-
70
-
71
-
72
-
73
-
74
-
75
-
76
-
77
-
78
-
79
-
80
-
81
-
82
-
83
-
84
-
85
-
86
-
87
-
 88
88 -
 89
89 -
 90
90 -
 91
91 -
 92
92 -
 93
93 -
 94
94 -
 95
95 -
 96
96 -
 97
97 -
 98
98 -
 99
99 -
 100
100 -
 101
101 -
 102
102 -
 103
103 -
 104
104 -
 105
105 -
 106
106 -
 107
107 -
 108
108 -
109
-
110
-
111
-
112
-
113
-
114
-
115
-
116
-
117
-
118
-
119
-
120
-
121
-
122
-
123
-
124
-
125
-
126
-
127
-
128
-
129
-
130
-
131
-
132
-
133
-
134
-
135
-
136
-
137
-
138
-
139
-
140
-
141
-
142
-
143
-
144
-
145
-
146
-
147
-
148
-
149
-
150
-
151
-
152
-
153
-
154
-
155
-
156
-
157
-
158
-
159
-
160
-
161
-
162
-
163
-
164
-
165
-
166
-
167
-
168
-
169
-
170
-
171
-
172
-
173
-
174
-
175
-
176
-
177
-
178
-
179
-
180
-
181
-
182
-
183
-
184
-
185
-
186
-
187
-
188
-
189
-
190
-
191
-
192
-
193
-
194
-
195
-
196
-
197
-
198
-
199
-
200
-
201
-
202
-
203
-
204
-
205
-
206
-
207
-
208
-
209
-
210
-
211
-
212
-
213
-
214
 |
 |

88
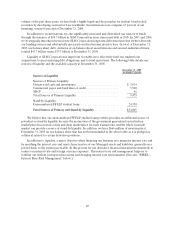
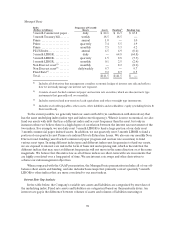
The following table provides the historical effect of our Co-Cos on our common stock equivalents
(“CSEs”) and after-tax interest expense in connection with the retroactive implementation of EITF
No. 04-8 for the years ended December 31, 2005, 2004 and 2003.
Years ended December 31,
2005 2004 2003
(in thousands)
CSE impact of Co-Cos (shares) .................... 30,312 30,312
18,769
Co-Cos after-tax interest expense.................. $44,572 $21,405 $ 11,005
Securitization Activities
Securitization Program
Our FFELP Stafford, Private Education Loan and Consolidation Loan securitizations are structured
such that they are legally sales of assets using a two-step transaction with a special purpose entity that
legally isolates the transferred assets from the Company and its creditors, even in the event of bankruptcy.
The holders of the beneficial interests issued by the special purpose entity are not constrained from
pledging or exchanging their interests. In all of our securitizations, we retain the right to receive cash flows
from the student loans and reserve accounts in excess of the amounts needed to pay servicing, derivative costs
(if any), other fees, and the principal and interest on the bonds backed by the student loans. The investors of
the securitization trusts have no recourse to the Company’s other assets should there be a failure of the
securities backed by student loans to pay when due. Some of our securitizations meet the requirements for
GAAP sale treatment through a two-step sale to a qualifying special purpose entity (“QSPE”) according to
the criteria of SFAS No. 140. Under these criteria, we do not maintain effective control over the
transferred assets. Accordingly, these transactions receive off-balance sheet accounting treatment.
In certain Consolidation Loan securitization structures, we hold rights that can affect the remarketing
of the bonds, such that these trusts did not qualify as QSPEs and as a result are required to be accounted
for on-balance sheet as variable interest entities (“VIEs”). These securitization structures were developed
to broaden and diversify the investor base for Consolidation Loan securitizations by allowing us to issue
bonds with shorter expected maturities and with non-amortizing, fixed rate and foreign currency
denominated tranches. As of December 31, 2005, we had $40.9 billion of securitized student loans in on-
balance sheet securitization trusts. These securitizations are included as financings in the table below.
We recognize a gain on sales related to securitizations that qualify as off-balance sheet transactions.
The gain is calculated as the difference between the allocated cost basis of the assets sold and the relative
fair value of the assets received. The carrying value of the student loan portfolio being securitized includes
the applicable accrued interest, unamortized student loan premiums or discounts, loan loss reserves and
Borrower Benefits reserves. The fair value of the Residual Interest is determined using a discounted cash
flow methodology using assumptions discussed in more detail below. The ongoing earnings from our off-
balance sheet securitizations are recognized in servicing and securitization revenue.