Sallie Mae 2005 Annual Report Download - page 50
Download and view the complete annual report
Please find page 50 of the 2005 Sallie Mae annual report below. You can navigate through the pages in the report by either clicking on the pages listed below, or by using the keyword search tool below to find specific information within the annual report.-
 1
1 -
2
-
3
-
4
-
5
-
6
-
7
-
8
-
9
-
10
-
11
-
12
-
13
-
14
-
15
-
16
-
17
-
18
-
19
-
20
-
21
-
22
-
23
-
24
-
25
-
26
-
27
-
28
-
29
-
30
-
31
-
32
-
33
-
34
-
35
-
36
-
37
-
38
-
39
-
 40
40 -
 41
41 -
 42
42 -
 43
43 -
 44
44 -
 45
45 -
 46
46 -
 47
47 -
 48
48 -
 49
49 -
 50
50 -
 51
51 -
 52
52 -
 53
53 -
 54
54 -
 55
55 -
 56
56 -
 57
57 -
 58
58 -
 59
59 -
 60
60 -
61
-
62
-
63
-
64
-
65
-
66
-
67
-
68
-
69
-
70
-
71
-
72
-
73
-
74
-
75
-
76
-
77
-
78
-
79
-
80
-
81
-
82
-
83
-
84
-
85
-
86
-
87
-
88
-
89
-
90
-
91
-
92
-
93
-
94
-
95
-
96
-
97
-
98
-
99
-
100
-
101
-
102
-
103
-
104
-
105
-
106
-
107
-
108
-
109
-
110
-
111
-
112
-
113
-
114
-
115
-
116
-
117
-
118
-
119
-
120
-
121
-
122
-
123
-
124
-
125
-
126
-
127
-
128
-
129
-
130
-
131
-
132
-
133
-
134
-
135
-
136
-
137
-
138
-
139
-
140
-
141
-
142
-
143
-
144
-
145
-
146
-
147
-
148
-
149
-
150
-
151
-
152
-
153
-
154
-
155
-
156
-
157
-
158
-
159
-
160
-
161
-
162
-
163
-
164
-
165
-
166
-
167
-
168
-
169
-
170
-
171
-
172
-
173
-
174
-
175
-
176
-
177
-
178
-
179
-
180
-
181
-
182
-
183
-
184
-
185
-
186
-
187
-
188
-
189
-
190
-
191
-
192
-
193
-
194
-
195
-
196
-
197
-
198
-
199
-
200
-
201
-
202
-
203
-
204
-
205
-
206
-
207
-
208
-
209
-
210
-
211
-
212
-
213
-
214
 |
 |

40
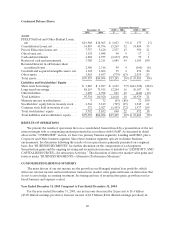
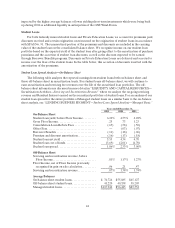
Condensed Balance Sheets
Increase (decrease)
December 31, 2005 vs. 2004 2004 vs. 2003
2005 2004 $ % $ %
Assets
FFELP Stafford and Other Student Loans,
net................................... $19,988 $18,965 $ 1,023 5 % $ 175 1%
ConsolidationLoans,net.................. 54,859 41,596 13,263 32 14,809 55
PrivateEducationLoans,net .............. 7,757 5,420 2,337 43 950 21
Otherloans,net.......................... 1,138 1,048 90 9 17 2
Cashandinvestments..................... 4,868 6,975 (2,107) (30) 79 1
Restricted cash and investments............ 3,300 2,211 1,089 49 1,105 100
Retained Interest in off-balance sheet
securitized loans ....................... 2,406 2,316 90 4 (160 ) (6)
Goodwill and acquired intangible assets, net . 1,105 1,066 39 4 474 80
Otherassets............................. 3,918 4,497 (579) (13) 2,034 83
Totalassets.............................. $99,339 $84,094 $ 15,245 18 % $ 19,483 30%
Liabilities and Stockholders’ Equity
Short-term borrowings .................... $ 3,810 $ 2,207 $ 1,603 73%$(16,528) (88)%
Long-term borrowings .................... 88,119 75,915 12,204 16 36,107 91
Otherliabilities.......................... 3,609 2,798 811 29 (640) (19)
Totalliabilities........................... 95,538 80,920 14,618 18 18,939 31
Minority interest insubsidiaries............ 9 72 (63) (88) 72 100
Stockholders’ equity before treasury stock . . . 4,364 5,129 (765) (15 ) 1,949 61
Common stock held in treasury at cost...... 572 2,027 (1,455) (72) 1,477 269
Total stockholders’ equity................. 3,792 3,102 690 22 472 18
Total liabilities andstockholders’ equity..... $99,339 $84,094 $ 15,245 18 % $ 19,483 30%
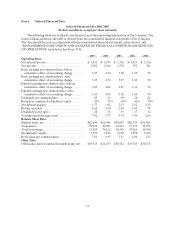
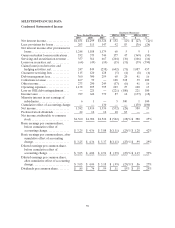
RESULTS OF OPERATIONS
We present the results of operations first on a consolidated basis followed by a presentation of the net
interest margin with accompanying analysis presented in accordance with GAAP. As discussed in detail
above in the “OVERVIEW” section, we have two primary business segments, Lending and DMO, plus a
Corporate and Other business segment. Since these business segments operate in distinct business
environments, the discussion following the results of our operations is primarily presented on a segment
basis. See “BUSINESS SEGMENTS” for further discussion on the components of each segment.
Securitization gains and the ongoing servicing and securitization income is included in “LIQUIDITY AND
CAPITAL RESOURCES—Securitization Activities.” The discussion of derivative market value gains and
losses is under “BUSINESS SEGMENTS—Alternative Performance Measures.”
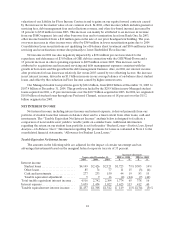
CONSOLIDATED EARNINGS SUMMARY
The main drivers of our net income are the growth in our Managed student loan portfolio, which
drives net interest income and securitization transactions, market value gains and losses on derivatives that
do not receive hedge accounting treatment, the timing and size of securitization gains, growth in our fee-
based business and expense control.
Year Ended December 31, 2005 Compared to Year Ended December 31, 2004
For the year ended December 31, 2005, our net income decreased by 26 percent to $1.4 billion
($3.05 diluted earnings per share) from net income of $1.9 billion ($4.04 diluted earnings per share) in