Sallie Mae 2005 Annual Report Download - page 58
Download and view the complete annual report
Please find page 58 of the 2005 Sallie Mae annual report below. You can navigate through the pages in the report by either clicking on the pages listed below, or by using the keyword search tool below to find specific information within the annual report.-
 1
1 -
2
-
3
-
4
-
5
-
6
-
7
-
8
-
9
-
10
-
11
-
12
-
13
-
14
-
15
-
16
-
17
-
18
-
19
-
20
-
21
-
22
-
23
-
24
-
25
-
26
-
27
-
28
-
29
-
30
-
31
-
32
-
33
-
34
-
35
-
36
-
37
-
38
-
39
-
40
-
41
-
42
-
43
-
44
-
45
-
46
-
47
-
 48
48 -
 49
49 -
 50
50 -
 51
51 -
 52
52 -
 53
53 -
 54
54 -
 55
55 -
 56
56 -
 57
57 -
 58
58 -
 59
59 -
 60
60 -
 61
61 -
 62
62 -
 63
63 -
 64
64 -
 65
65 -
 66
66 -
 67
67 -
 68
68 -
69
-
70
-
71
-
72
-
73
-
74
-
75
-
76
-
77
-
78
-
79
-
80
-
81
-
82
-
83
-
84
-
85
-
86
-
87
-
88
-
89
-
90
-
91
-
92
-
93
-
94
-
95
-
96
-
97
-
98
-
99
-
100
-
101
-
102
-
103
-
104
-
105
-
106
-
107
-
108
-
109
-
110
-
111
-
112
-
113
-
114
-
115
-
116
-
117
-
118
-
119
-
120
-
121
-
122
-
123
-
124
-
125
-
126
-
127
-
128
-
129
-
130
-
131
-
132
-
133
-
134
-
135
-
136
-
137
-
138
-
139
-
140
-
141
-
142
-
143
-
144
-
145
-
146
-
147
-
148
-
149
-
150
-
151
-
152
-
153
-
154
-
155
-
156
-
157
-
158
-
159
-
160
-
161
-
162
-
163
-
164
-
165
-
166
-
167
-
168
-
169
-
170
-
171
-
172
-
173
-
174
-
175
-
176
-
177
-
178
-
179
-
180
-
181
-
182
-
183
-
184
-
185
-
186
-
187
-
188
-
189
-
190
-
191
-
192
-
193
-
194
-
195
-
196
-
197
-
198
-
199
-
200
-
201
-
202
-
203
-
204
-
205
-
206
-
207
-
208
-
209
-
210
-
211
-
212
-
213
-
214
 |
 |

48
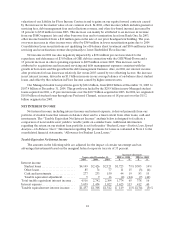
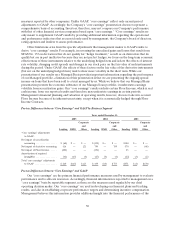
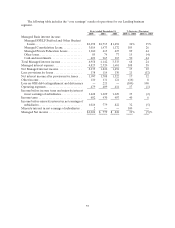
Year ended December 31, 2005
Lending DMO
Corporate
and Other
Managed interest income:
Managed FFELP Stafford and Other Student Loans................. $2,298 $ — $ —
Managed Consolidation Loans.................................... 3,014 — —
Managed Private Education Loans................................ 1,160 — —
Other loans..................................................... 85 — —
Cash and investments............................................ 401 — —
Total Managed interest income..................................... 6,958 — —
Managed interest expense.......................................... 4,823 — —
Net interest income................................................ 2,135 — —
Less: provisionsfor losses .......................................... 138 — —
Net interest income after provisions for losses ........................ 1,997 — —
Fee income....................................................... — 360 115
Collections revenue ............................................... — 167 —
Other income..................................................... 110 — 126
Operating expenses................................................ 479 283 308
Income tax expense (benefit)(1) ...................................... 602 91 (25)
Minority interest innet earningsofsubsidiaries ....................... 2 4 —
Managed net income (loss)......................................... $1,024 $149 $ (42)
Year ended December 31, 2004
Lending DMO
Corporate
and Other
Managed interest income:
Managed FFELP Stafford and Other Student Loans.................. $1,715 $ — $ —
Managed Consolidation Loans..................................... 1,473 — —
Managed Private Education Loans................................. 613 — —
Other loans...................................................... 74 — —
Cash and investments............................................. 267 — —
Total Managed interest income...................................... 4,142 — —
Managed interest expense........................................... 2,320 — —
Net interest income................................................. 1,822 — —
Less: provisionsfor losses ........................................... 114 — —
Net interest income after provisions for losses ......................... 1,708 — —
Fee income........................................................ — 300 120
Collections revenue ................................................ — 39 —
Other income...................................................... 131 — 130
Loss on GSEdebt and extinguishment................................ 221 — —
Operating expenses................................................. 409 159 291
Income tax expense (benefit)(1) ....................................... 430 65 (15)
Minority interest innet earningsofsubsidiaries ........................ — 1 —
Managed net income (loss).......................................... $ 779 $114 $ (26)
(1) Income taxes are based on a percentage of net income before tax for the individual reportable segment.