Sallie Mae 2005 Annual Report Download - page 82
Download and view the complete annual report
Please find page 82 of the 2005 Sallie Mae annual report below. You can navigate through the pages in the report by either clicking on the pages listed below, or by using the keyword search tool below to find specific information within the annual report.-
 1
1 -
2
-
3
-
4
-
5
-
6
-
7
-
8
-
9
-
10
-
11
-
12
-
13
-
14
-
15
-
16
-
17
-
18
-
19
-
20
-
21
-
22
-
23
-
24
-
25
-
26
-
27
-
28
-
29
-
30
-
31
-
32
-
33
-
34
-
35
-
36
-
37
-
38
-
39
-
40
-
41
-
42
-
43
-
44
-
45
-
46
-
47
-
48
-
49
-
50
-
51
-
52
-
53
-
54
-
55
-
56
-
57
-
58
-
59
-
60
-
61
-
62
-
63
-
64
-
65
-
66
-
67
-
68
-
69
-
70
-
71
-
 72
72 -
 73
73 -
 74
74 -
 75
75 -
 76
76 -
 77
77 -
 78
78 -
 79
79 -
 80
80 -
 81
81 -
 82
82 -
 83
83 -
 84
84 -
 85
85 -
 86
86 -
 87
87 -
 88
88 -
 89
89 -
 90
90 -
 91
91 -
 92
92 -
93
-
94
-
95
-
96
-
97
-
98
-
99
-
100
-
101
-
102
-
103
-
104
-
105
-
106
-
107
-
108
-
109
-
110
-
111
-
112
-
113
-
114
-
115
-
116
-
117
-
118
-
119
-
120
-
121
-
122
-
123
-
124
-
125
-
126
-
127
-
128
-
129
-
130
-
131
-
132
-
133
-
134
-
135
-
136
-
137
-
138
-
139
-
140
-
141
-
142
-
143
-
144
-
145
-
146
-
147
-
148
-
149
-
150
-
151
-
152
-
153
-
154
-
155
-
156
-
157
-
158
-
159
-
160
-
161
-
162
-
163
-
164
-
165
-
166
-
167
-
168
-
169
-
170
-
171
-
172
-
173
-
174
-
175
-
176
-
177
-
178
-
179
-
180
-
181
-
182
-
183
-
184
-
185
-
186
-
187
-
188
-
189
-
190
-
191
-
192
-
193
-
194
-
195
-
196
-
197
-
198
-
199
-
200
-
201
-
202
-
203
-
204
-
205
-
206
-
207
-
208
-
209
-
210
-
211
-
212
-
213
-
214
 |
 |

72
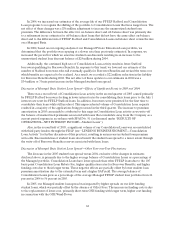
The year-over-year increase in forbearance as a percentage of loans in repayment and forbearance is
due primarily to the increase in collections staffing in response to the seasonality of the loans entering
repayment. This increase in staffing has resulted in an increase in cash collections, lower delinquency
percentages, as well as an increase in the use of forbearance for those student borrowers that are in need
of short term forbearance in order to make timely payments as they have recently graduated. On a
percentage basis, the figures are within management expectations.
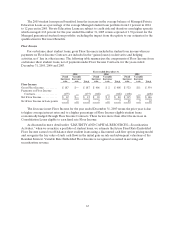
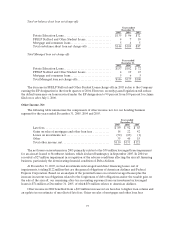
The table below stratifies the portfolio of Managed Private Education Loans in forbearance by the
cumulative number of months the borrower has used forbearance as of the dates indicated. As detailed in
the table below, seven percent of loans currently in forbearance have cumulative forbearance of more than
24 months, which is a decrease from the prior two years.
December 31, 2005 December 31, 2004 December 31, 2003
Forbearance
Balance
% of
Total
Forbearance
Balance
% of
Total
Forbearance
Balance
% of
Total
Cumulative number of
months borrower has
used forbearance
Up to 12months....... $686 75% $334 66% $326 67 %
13 to24 months........ 165 18 117 24 119 24
25 to36 months........ 44 5 30 6 26 5
More than 36 months. . . 22 2 19 4 20 4
Total................. $917 100% $500 100% $491 100 %
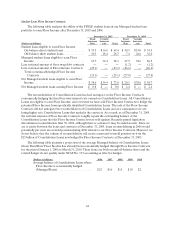
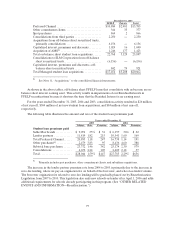
Allowance for FFELP Student Loan Losses
On February 8, 2006, the Reauthorization of the HEA was signed into law. (See “OTHER
RELATED EVENTS AND INFORMATION—Reauthorization” for a detailed discussion on the
Reauthorization Legislation and its impact on the Company.) The Reauthorization Legislation reduces the
level of default insurance to 97 percent from 98 percent (effectively increasing Risk Sharing from two
percent to three percent) on loans disbursed after July 1, 2006 for lenders without EP designation.
Furthermore, the Reauthorization Legislation reduces the default insurance paid to lenders/servicers with
the EP designation to 99 percent from 100 percent on claims filed on or after July 1, 2006. As a result of
the amended insurance levels, we established a Risk Sharing allowance as of December 31, 2005 for an
estimate of losses on FFELP student loans based on the one percent reduction in default insurance for
servicers with the EP designation. The reserve was established using a migration analysis similar to that
described above for the Private Education Loans before applying the appropriate Risk Sharing percentage.
As a result, for the year ended December 31, 2005, we provided for additional reserves of $10 million for
on-balance sheet FFELP loans and $19 million for Managed FFELP loans.
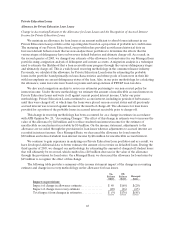
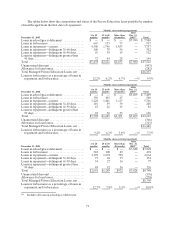
Total Loan Net Charge-offs
The following tables summarize the net charge-offs for all loan types on both an on-balance sheet
basis and a Managed Basis for the years ended December 31, 2005, 2004 and 2003.