Sallie Mae 2005 Annual Report Download - page 60
Download and view the complete annual report
Please find page 60 of the 2005 Sallie Mae annual report below. You can navigate through the pages in the report by either clicking on the pages listed below, or by using the keyword search tool below to find specific information within the annual report.-
 1
1 -
2
-
3
-
4
-
5
-
6
-
7
-
8
-
9
-
10
-
11
-
12
-
13
-
14
-
15
-
16
-
17
-
18
-
19
-
20
-
21
-
22
-
23
-
24
-
25
-
26
-
27
-
28
-
29
-
30
-
31
-
32
-
33
-
34
-
35
-
36
-
37
-
38
-
39
-
40
-
41
-
42
-
43
-
44
-
45
-
46
-
47
-
48
-
49
-
 50
50 -
 51
51 -
 52
52 -
 53
53 -
 54
54 -
 55
55 -
 56
56 -
 57
57 -
 58
58 -
 59
59 -
 60
60 -
 61
61 -
 62
62 -
 63
63 -
 64
64 -
 65
65 -
 66
66 -
 67
67 -
 68
68 -
 69
69 -
 70
70 -
71
-
72
-
73
-
74
-
75
-
76
-
77
-
78
-
79
-
80
-
81
-
82
-
83
-
84
-
85
-
86
-
87
-
88
-
89
-
90
-
91
-
92
-
93
-
94
-
95
-
96
-
97
-
98
-
99
-
100
-
101
-
102
-
103
-
104
-
105
-
106
-
107
-
108
-
109
-
110
-
111
-
112
-
113
-
114
-
115
-
116
-
117
-
118
-
119
-
120
-
121
-
122
-
123
-
124
-
125
-
126
-
127
-
128
-
129
-
130
-
131
-
132
-
133
-
134
-
135
-
136
-
137
-
138
-
139
-
140
-
141
-
142
-
143
-
144
-
145
-
146
-
147
-
148
-
149
-
150
-
151
-
152
-
153
-
154
-
155
-
156
-
157
-
158
-
159
-
160
-
161
-
162
-
163
-
164
-
165
-
166
-
167
-
168
-
169
-
170
-
171
-
172
-
173
-
174
-
175
-
176
-
177
-
178
-
179
-
180
-
181
-
182
-
183
-
184
-
185
-
186
-
187
-
188
-
189
-
190
-
191
-
192
-
193
-
194
-
195
-
196
-
197
-
198
-
199
-
200
-
201
-
202
-
203
-
204
-
205
-
206
-
207
-
208
-
209
-
210
-
211
-
212
-
213
-
214
 |
 |

50
measures reported by other companies. Unlike GAAP, “core earnings” reflect only current period
adjustments to GAAP. Accordingly, the Company’s “core earnings” presentation does not represent a
comprehensive basis of accounting. Investors, therefore, may not compare our Company’s performance
with that of other financial services companies based upon “core earnings.” “Core earnings” results are
only meant to supplement GAAP results by providing additional information regarding the operational
and performance indicators that are most closely used by management, the Company’s board of directors,
rating agencies and lenders to assess performance.
Other limitations arise from the specific adjustments that management makes to GAAP results to
derive “core earnings” results. For example, in reversing the unrealized gains and losses that result from
SFAS No. 133 on derivatives that do not qualify for “hedge treatment,” as well as on derivatives that do
qualify but are in part ineffective because they are not perfect hedges, we focus on the long-term economic
effectiveness of those instruments relative to the underlying hedged item and isolate the effects of interest
rate volatility, changing credit spreads and changes in our stock price on the fair value of such instruments
during the period. Under GAAP, the effects of these factors on the fair value of the derivative instruments
(but not on the underlying hedged item) tend to show more volatility in the short term. While our
presentation of our results on a Managed Basis provides important information regarding the performance
of our Managed portfolio, a limitation of this presentation is that we are presenting the ongoing spread
income on loans that have been sold to a trust managed by us. While we believe that our Managed Basis
presentation presents the economic substance of our Managed loan portfolio, it understates earnings
volatility from securitization gains. Our “core earnings” results exclude certain Floor Income, which is real
cash income, from our reported results and therefore may understate earnings in certain periods.
Management’s financial planning and valuation of operating results, however, does not take into account
Floor Income because of its inherent uncertainty, except when it is economically hedged through Floor
Income Contracts.
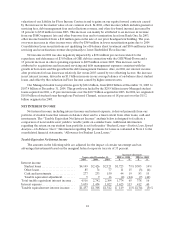
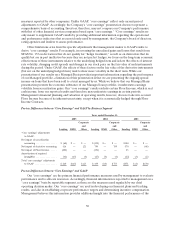
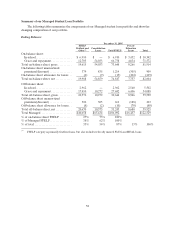
Pre-tax Differences between “Core Earnings” and GAAP by Business Segment
Years ended December 31,
2005 2004 2003
Lending DMO
Corporate
and
Other Lending DMO
Corporate
and
Other Lending DMO
Corporate
and
Other
“Core earnings” adjustments
to GAAP:
Net impact of securitization
accounting ................. $ (60) $ — $ — $ (152) $ — $ — $ 300 $ — $ —
Net impact of derivative accounting 516 — 121 794 — 759 570 — (68)
Net impact of FloorIncome...... (204) — — (156) — — 23 — —
Amortization of acquired
intangibles ................. (42 ) (15) (4) (27) (5) (4) (22 ) (3 ) (2)
Total “core earnings” adjustments
to GAAP .................. $ 210 $ (15) $ 117 $ 459 $ (5) $ 755 $ 871 $ (3) $ (70)
Pre-tax Differences between “Core Earnings” and GAAP
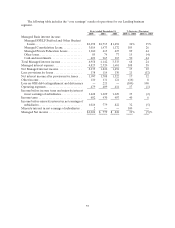
Our “core earnings” are the primary financial performance measures used by management to evaluate
performance and to allocate resources. Accordingly, financial information is reported to management on a
“core earnings” basis by reportable segment, as these are the measures used regularly by our chief
operating decision maker. Our “core earnings” are used in developing our financial plans and tracking
results, and also in establishing corporate performance targets and determining incentive compensation.
Management believes this information provides additional insight into the financial performance of the