Sallie Mae 2005 Annual Report Download - page 145
Download and view the complete annual report
Please find page 145 of the 2005 Sallie Mae annual report below. You can navigate through the pages in the report by either clicking on the pages listed below, or by using the keyword search tool below to find specific information within the annual report.-
 1
1 -
2
-
3
-
4
-
5
-
6
-
7
-
8
-
9
-
10
-
11
-
12
-
13
-
14
-
15
-
16
-
17
-
18
-
19
-
20
-
21
-
22
-
23
-
24
-
25
-
26
-
27
-
28
-
29
-
30
-
31
-
32
-
33
-
34
-
35
-
36
-
37
-
38
-
39
-
40
-
41
-
42
-
43
-
44
-
45
-
46
-
47
-
48
-
49
-
50
-
51
-
52
-
53
-
54
-
55
-
56
-
57
-
58
-
59
-
60
-
61
-
62
-
63
-
64
-
65
-
66
-
67
-
68
-
69
-
70
-
71
-
72
-
73
-
74
-
75
-
76
-
77
-
78
-
79
-
80
-
81
-
82
-
83
-
84
-
85
-
86
-
87
-
88
-
89
-
90
-
91
-
92
-
93
-
94
-
95
-
96
-
97
-
98
-
99
-
100
-
101
-
102
-
103
-
104
-
105
-
106
-
107
-
108
-
109
-
110
-
111
-
112
-
113
-
114
-
115
-
116
-
117
-
118
-
119
-
120
-
121
-
122
-
123
-
124
-
125
-
126
-
127
-
128
-
129
-
130
-
131
-
132
-
133
-
134
-
 135
135 -
 136
136 -
 137
137 -
 138
138 -
 139
139 -
 140
140 -
 141
141 -
 142
142 -
 143
143 -
 144
144 -
 145
145 -
 146
146 -
 147
147 -
 148
148 -
 149
149 -
 150
150 -
 151
151 -
 152
152 -
 153
153 -
 154
154 -
 155
155 -
156
-
157
-
158
-
159
-
160
-
161
-
162
-
163
-
164
-
165
-
166
-
167
-
168
-
169
-
170
-
171
-
172
-
173
-
174
-
175
-
176
-
177
-
178
-
179
-
180
-
181
-
182
-
183
-
184
-
185
-
186
-
187
-
188
-
189
-
190
-
191
-
192
-
193
-
194
-
195
-
196
-
197
-
198
-
199
-
200
-
201
-
202
-
203
-
204
-
205
-
206
-
207
-
208
-
209
-
210
-
211
-
212
-
213
-
214
 |
 |

SLM CORPORATION
NOTES TO CONSOLIDATED FINANCIAL STATEMENTS (Continued)
(Dollars in thousands, except per share amounts, unless otherwise stated)
F-23
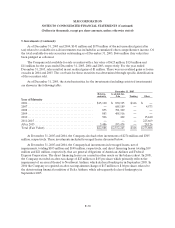
3. Student Loans (Continued)
FFELP loans originated on or after October 1, 1993 is set at 98 percent but can be increased to 100 percent
if a servicer qualifies for the EP designation as discussed in “Allowance for FFELP Student Loan Losses”
in Note 4. The two percent uninsured portion is referred to as Risk Sharing for holders of these loans.
Insurance on FFELP loans is provided by certain state or non-profit guarantee agencies, which are
reinsured by the federal government. At December 31, 2005 and 2004, the Company owned $5.5 billion
and $6.9 billion of 98 percent reinsured FFELP loans, and $67.2 billion and $51.7 billion of 100 percent
reinsured loans, respectively. On February 8, 2006, the Reauthorization Legislation was signed into law.
The legislation reduces lender reinsurance to 99 percent with EP designation for claims filed after July 1,
2006 and 97 percent without designation on loans disbursed after July 1, 2006. Health Education
Assistance Loans (“HEAL”) are directly insured 100 percent by the federal government.
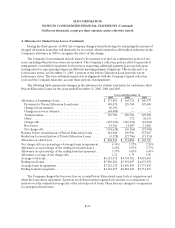
In addition to federal loan programs, which place statutory limits on per year and total borrowing, the
Company offers a variety of Private Education Loans. Private Education Loans for post-secondary
education and loans for career training can be subdivided into two main categories: loans that supplement
FFELP student loans primarily for higher and lifelong learning programs and loans for career training. For
the majority of the Private Education Loan portfolio, the Company bears the full risk of any losses
experienced and as a result, these loans are underwritten and priced based upon standardized consumer
credit scoring criteria. In addition, students who do not meet the Company’s minimum underwriting
standards are required to obtain a credit-worthy co-borrower. Approximately 50 percent of the Company’s
Private Education Loans have a co-borrower. Certain Private Education Loans do not require repayment,
or have modified repayment plans, while the borrower is in-school and during the grace period
immediately upon leaving school. The borrower may also be granted a deferment or forbearance for a
period of time based on need, during which time the borrower is not considered to be in repayment.
Interest continues to accrue on loans in the in-school, deferment and forbearance period.
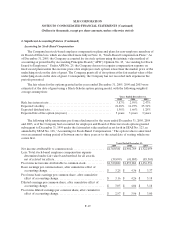
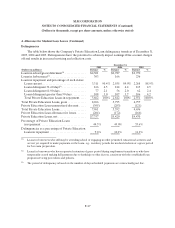
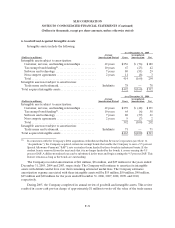
The estimated weighted average life of student loans in the Company’s portfolio was approximately
9.4 years and 8.7 years at December 31, 2005 and 2004, respectively. The following table reflects the
distribution of the Company’s student loan portfolio by program.
December 31, 2005
Year ended
December 31, 2005
Ending
Balance
% of
Balance
Average
Balance
Average
Effective
Interest
Rate
FFELP Stafford and Other Student Loans, net(1) ...... $19,988,116 24% $20,719,942 4.90%
ConsolidationLoans,net........................... 54,858,676 67 47,082,001 5.31
Private Education loans, net........................ 7,756,770 9 6,921,975 9.16
Total student loans, net(2)........................... $82,603,562 100% $74,723,918 5.55%
(1) The FFELP category is primarily Stafford loans, but also includes federally insured PLUS and HEAL loans.
(2) The total student loan balance includes net unamortized premiums/discounts of $909,417 and $787,696 as of
December 31, 2005 and 2004, respectively.