Sallie Mae 2005 Annual Report Download - page 181
Download and view the complete annual report
Please find page 181 of the 2005 Sallie Mae annual report below. You can navigate through the pages in the report by either clicking on the pages listed below, or by using the keyword search tool below to find specific information within the annual report.-
 1
1 -
2
-
3
-
4
-
5
-
6
-
7
-
8
-
9
-
10
-
11
-
12
-
13
-
14
-
15
-
16
-
17
-
18
-
19
-
20
-
21
-
22
-
23
-
24
-
25
-
26
-
27
-
28
-
29
-
30
-
31
-
32
-
33
-
34
-
35
-
36
-
37
-
38
-
39
-
40
-
41
-
42
-
43
-
44
-
45
-
46
-
47
-
48
-
49
-
50
-
51
-
52
-
53
-
54
-
55
-
56
-
57
-
58
-
59
-
60
-
61
-
62
-
63
-
64
-
65
-
66
-
67
-
68
-
69
-
70
-
71
-
72
-
73
-
74
-
75
-
76
-
77
-
78
-
79
-
80
-
81
-
82
-
83
-
84
-
85
-
86
-
87
-
88
-
89
-
90
-
91
-
92
-
93
-
94
-
95
-
96
-
97
-
98
-
99
-
100
-
101
-
102
-
103
-
104
-
105
-
106
-
107
-
108
-
109
-
110
-
111
-
112
-
113
-
114
-
115
-
116
-
117
-
118
-
119
-
120
-
121
-
122
-
123
-
124
-
125
-
126
-
127
-
128
-
129
-
130
-
131
-
132
-
133
-
134
-
135
-
136
-
137
-
138
-
139
-
140
-
141
-
142
-
143
-
144
-
145
-
146
-
147
-
148
-
149
-
150
-
151
-
152
-
153
-
154
-
155
-
156
-
157
-
158
-
159
-
160
-
161
-
162
-
163
-
164
-
165
-
166
-
167
-
168
-
169
-
170
-
 171
171 -
 172
172 -
 173
173 -
 174
174 -
 175
175 -
 176
176 -
 177
177 -
 178
178 -
 179
179 -
 180
180 -
 181
181 -
 182
182 -
 183
183 -
 184
184 -
 185
185 -
 186
186 -
 187
187 -
 188
188 -
 189
189 -
 190
190 -
 191
191 -
192
-
193
-
194
-
195
-
196
-
197
-
198
-
199
-
200
-
201
-
202
-
203
-
204
-
205
-
206
-
207
-
208
-
209
-
210
-
211
-
212
-
213
-
214
 |
 |

SLM CORPORATION
NOTES TO CONSOLIDATED FINANCIAL STATEMENTS (Continued)
(Dollars in thousands, except per share amounts, unless otherwise stated)
F-59
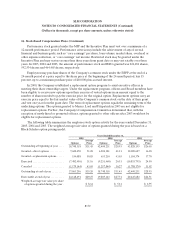
16. Stock-Based Compensation Plans (Continued)
Performance stock granted under the MIP and the Incentive Plan must vest over a minimum of a
12-month performance period. Performance criteria may include the achievement of any of several
financial and business goals, such as “core earnings” per share, loan volume, market share, overhead or
other expense reduction, or “core earnings” net income. Restricted stock may be granted under the
Incentive Plan and may vest no sooner than three years from grant date or may vest ratably over three
years. In 2005, 2004 and 2003, the amount of performance stock and RSUs granted was 226,681 shares,
592,534 shares and 464,465 shares, respectively.
Employees may purchase shares of the Company’s common stock under the ESPP at the end of a
24-month period at a price equal to the share price at the beginning of the 24-month period, less 15
percent, up to a maximum purchase price of $10,000 plus accrued interest.
In 2000, the Company established a replacement option program to assist executive officers in
meeting their share ownership targets. Under the replacement program, officers and Board members have
been eligible to receive new options upon their exercise of vested options in an amount equal to the
number of shares needed to pay the exercise price for the original option. Replacement options carry an
exercise price equal to the fair market value of the Company’s common stock on the date of their grant
and vest one year from the grant date. The term of replacement options equals the remaining term of the
underlying options. The options granted to Messrs. Lord and Fitzpatrick in 2003 are not eligible for
replacement options. Further, the Company’s Compensation Committee determined that, with the
exception of newly hired or promoted officers, options granted to other officers after 2003 would not be
eligible for replacement options.
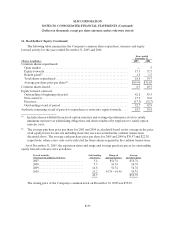
The following table summarizes the employee stock option activity for the years ended December 31,
2005, 2004 and 2003. The weighted average fair value of options granted during the year is based on a
Black-Scholes option pricing model.
Years Ended December 31,
2005 2004 2003
Options
Average
Price Options
Average
Price Options
Average
Price
Outstanding at beginning of year .... 38,748,318 $ 31.45 42,400,231 $ 28.93 43,828,155 $ 26.03
Granted—direct options ........... 7,622,450 51.28 6,204,181 41.11 10,009,627 36.18
Granted—replacement options...... 154,088 50.85 633,210 43.03 1,184,374 37.70
Exercised........................ (7,482,456) 31.16 (9,231,460) 26.51 (10,833,755 ) 24.50
Canceled ........................ (1,179,144) 43.69 (1,257,844) 36.27 (1,788,170 ) 31.02
Outstanding at end of year ......... 37,863,256 $ 35.20 38,748,318 $ 31.45 42,400,231 $ 28.93
Exercisable at end of year.......... 24,148,491 $ 29.27 19,805,143 $ 27.71 20,445,682 $ 24.51
Weighted-average fair value per share
of options granted during the year . $ 8.64 $ 5.14 $ 6.95