Sallie Mae 2005 Annual Report Download - page 57
Download and view the complete annual report
Please find page 57 of the 2005 Sallie Mae annual report below. You can navigate through the pages in the report by either clicking on the pages listed below, or by using the keyword search tool below to find specific information within the annual report.-
 1
1 -
2
-
3
-
4
-
5
-
6
-
7
-
8
-
9
-
10
-
11
-
12
-
13
-
14
-
15
-
16
-
17
-
18
-
19
-
20
-
21
-
22
-
23
-
24
-
25
-
26
-
27
-
28
-
29
-
30
-
31
-
32
-
33
-
34
-
35
-
36
-
37
-
38
-
39
-
40
-
41
-
42
-
43
-
44
-
45
-
46
-
 47
47 -
 48
48 -
 49
49 -
 50
50 -
 51
51 -
 52
52 -
 53
53 -
 54
54 -
 55
55 -
 56
56 -
 57
57 -
 58
58 -
 59
59 -
 60
60 -
 61
61 -
 62
62 -
 63
63 -
 64
64 -
 65
65 -
 66
66 -
 67
67 -
68
-
69
-
70
-
71
-
72
-
73
-
74
-
75
-
76
-
77
-
78
-
79
-
80
-
81
-
82
-
83
-
84
-
85
-
86
-
87
-
88
-
89
-
90
-
91
-
92
-
93
-
94
-
95
-
96
-
97
-
98
-
99
-
100
-
101
-
102
-
103
-
104
-
105
-
106
-
107
-
108
-
109
-
110
-
111
-
112
-
113
-
114
-
115
-
116
-
117
-
118
-
119
-
120
-
121
-
122
-
123
-
124
-
125
-
126
-
127
-
128
-
129
-
130
-
131
-
132
-
133
-
134
-
135
-
136
-
137
-
138
-
139
-
140
-
141
-
142
-
143
-
144
-
145
-
146
-
147
-
148
-
149
-
150
-
151
-
152
-
153
-
154
-
155
-
156
-
157
-
158
-
159
-
160
-
161
-
162
-
163
-
164
-
165
-
166
-
167
-
168
-
169
-
170
-
171
-
172
-
173
-
174
-
175
-
176
-
177
-
178
-
179
-
180
-
181
-
182
-
183
-
184
-
185
-
186
-
187
-
188
-
189
-
190
-
191
-
192
-
193
-
194
-
195
-
196
-
197
-
198
-
199
-
200
-
201
-
202
-
203
-
204
-
205
-
206
-
207
-
208
-
209
-
210
-
211
-
212
-
213
-
214
 |
 |
47
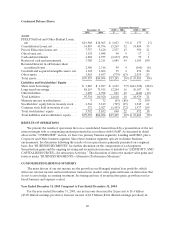
FEDERAL AND STATE TAXES
The Company is subject to federal and state income taxes, while the GSE was exempt from all state
and local income taxes. Our effective tax rate for the years ended December 31, 2005, 2004 and 2003 was
34 percent, 25 percent and 36 percent, respectively. The effective tax rate reflects the permanent impact of
the exclusion of gains and losses on equity forward contracts with respect to the Company’s stock for tax
purposes. The permanent differences were a $121 million gain in 2005, a $759 million gain in 2004 and a
$62 million loss in 2003, the year of adoption of SFAS No. 150.
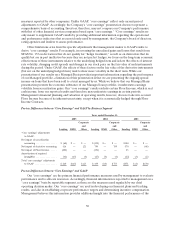
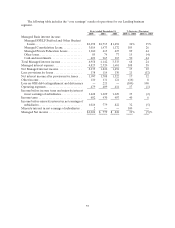
BUSINESS SEGMENTS
The results of operations of the Company’s Lending and DMO operating segments are presented
below. These defined business segments operate in distinct business environments and are considered
reportable segments under SFAS No. 131 based on quantitative thresholds applied to the Company’s
financial statements. In addition, we provide other complementary products and services, including
guarantor and student loan servicing, through smaller operating segments that do not meet such thresholds
and are aggregated in the Corporate and Other reportable segment for financial reporting purposes.
The management reporting process measures the performance of the Company’s operating segments
based on the management structure of the Company as well as the methodology used by management to
evaluate performance and allocate resources. Management, including the Company’s chief operating
decision maker, evaluates the performance of the Company’s operating segments based on their
profitability as measured by “core earnings.” Accordingly, information regarding the Company’s reportable
segments is provided herein based on “core earnings,” which are discussed in detail below. Our “core
earnings” are not defined terms within GAAP and may not be comparable to similarly titled measures
reported by other companies. “Core earnings” reflect only current period adjustments to GAAP as
described below. Unlike financial accounting, there is no comprehensive, authoritative guidance for
management reporting and as a result, our management reporting is not necessarily comparable with
similar information for any other financial institution. The Company’s operating segments are defined by
the products and services they offer or the types of customers they serve, and they reflect the manner in
which financial information is currently evaluated by management. Intersegment revenues and expenses
are netted within the appropriate financial statement line items consistent with the income statement
presentation provided to management. Changes in management structure or allocation methodologies and
procedures may result in changes in reported segment financial information.
“Core earnings” are the primary financial performance measures used by management to develop the
Company’s financial plans, track results, and establish corporate performance targets and incentive
compensation. While “core earnings” are not a substitute for reported results under GAAP, the Company
relies on “core earnings” in operating its business because “core earnings” permit management to make
meaningful period-to-period comparisons of the operational and performance indicators that are most
closely assessed by management. Management believes this information provides additional insight into
the financial performance of the core business activities of our operating segments. Accordingly, the tables
presented below reflect “core earnings” which is reviewed and utilized by management to manage the
business for each of the Company’s reportable segments. Included below under “Alternative Performance
Measures” is further discussion regarding “core earnings” and its limitations, including a table that details
the pre-tax differences between “core earnings” and GAAP by reportable segment.
The Lending operating segment includes all discussion of income and related expenses associated with
the net interest margin, the student loan spread and its components, the provisions for loan losses, and
other fees earned on our Managed portfolio of student loans. The DMO operating segment reflects the
fees earned and expenses incurred in providing accounts receivable management and collection services.
Our Corporate and Other reportable segment includes our remaining fee businesses and other corporate
expenses that do not pertain directly to the primary segments identified above.