Sallie Mae 2005 Annual Report Download - page 87
Download and view the complete annual report
Please find page 87 of the 2005 Sallie Mae annual report below. You can navigate through the pages in the report by either clicking on the pages listed below, or by using the keyword search tool below to find specific information within the annual report.-
 1
1 -
2
-
3
-
4
-
5
-
6
-
7
-
8
-
9
-
10
-
11
-
12
-
13
-
14
-
15
-
16
-
17
-
18
-
19
-
20
-
21
-
22
-
23
-
24
-
25
-
26
-
27
-
28
-
29
-
30
-
31
-
32
-
33
-
34
-
35
-
36
-
37
-
38
-
39
-
40
-
41
-
42
-
43
-
44
-
45
-
46
-
47
-
48
-
49
-
50
-
51
-
52
-
53
-
54
-
55
-
56
-
57
-
58
-
59
-
60
-
61
-
62
-
63
-
64
-
65
-
66
-
67
-
68
-
69
-
70
-
71
-
72
-
73
-
74
-
75
-
76
-
 77
77 -
 78
78 -
 79
79 -
 80
80 -
 81
81 -
 82
82 -
 83
83 -
 84
84 -
 85
85 -
 86
86 -
 87
87 -
 88
88 -
 89
89 -
 90
90 -
 91
91 -
 92
92 -
 93
93 -
 94
94 -
 95
95 -
 96
96 -
 97
97 -
98
-
99
-
100
-
101
-
102
-
103
-
104
-
105
-
106
-
107
-
108
-
109
-
110
-
111
-
112
-
113
-
114
-
115
-
116
-
117
-
118
-
119
-
120
-
121
-
122
-
123
-
124
-
125
-
126
-
127
-
128
-
129
-
130
-
131
-
132
-
133
-
134
-
135
-
136
-
137
-
138
-
139
-
140
-
141
-
142
-
143
-
144
-
145
-
146
-
147
-
148
-
149
-
150
-
151
-
152
-
153
-
154
-
155
-
156
-
157
-
158
-
159
-
160
-
161
-
162
-
163
-
164
-
165
-
166
-
167
-
168
-
169
-
170
-
171
-
172
-
173
-
174
-
175
-
176
-
177
-
178
-
179
-
180
-
181
-
182
-
183
-
184
-
185
-
186
-
187
-
188
-
189
-
190
-
191
-
192
-
193
-
194
-
195
-
196
-
197
-
198
-
199
-
200
-
201
-
202
-
203
-
204
-
205
-
206
-
207
-
208
-
209
-
210
-
211
-
212
-
213
-
214
 |
 |

77
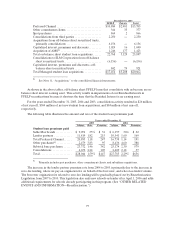
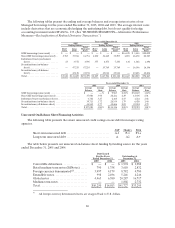
The following table summarizes the activity in our Managed portfolio of student loans for the years
ended December 31, 2005, 2004 and 2003.
Years Ended December 31,
2005 2004 2003
Beginningbalance ............................ $107,438 $ 88,789 $78,124
Acquisitions.................................. 28,045 27,783 18,657
Capitalized interest ........................... 2,161 2,133 2,005
Repayments, claims, other..................... (10,089) (8,548) (7,517)
Charge-offs to reserves and securitization trusts. . . (160) (135 ) (108 )
Loansales ................................... (168) (479 ) (38 )
Loans consolidated from SLM Corporation...... (4,698) (2,105) (2,334)
Endingbalance............................... $122,529 $107,438 $88,789
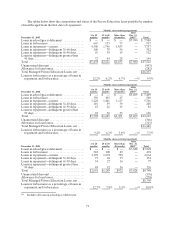
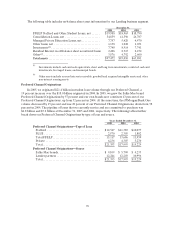
Consolidation Loan Activity
The following tables present the effect of Consolidation Loan activity on our Managed FFELP
portfolio.
Years ended December 31,
2005 2004 2003
FFELP
Stafford
and
Other(1) Consolidation
Loans
Total
FFELP
FFELP
Stafford
and
Other(1) Consolidation
Loans
Total
FFELP
FFELP
Stafford
and
Other(1) Consolidation
Loans
Total
FFELP
Beginning Managed balance ..... $ 46,790 $ 49,166 $ 95,956 $ 45,554 $ 34,930 $ 80,484 $ 47,053 $ 25,250 $ 72,303
Acquisitions................. 17,198 1,970 19,168 16,856 6,246 23,102 13,683 1,521 15,204
Incremental consolidations from
third parties ............... — 4,671 4,671 — 2,609 2,609 — 2,250 2,250
Internal consolidations(2) ........ (14,011 ) 14,011 — (7,687) 7,687 — (7,915 ) 7,915 —
Consolidations to third parties.... (3,089 ) (1,580) (4,669) (1,780) (314) (2,094) (2,024 ) (279 ) (2,303)
Repayments/claims/resales/other . . (6,230 ) (2,804) (9,034) (6,153) (1,992) (8,145) (5,243 ) (1,727 ) (6,970)
Ending Managed balance ....... $ 40,658 $ 65,434 $ 106,092 $ 46,790 $ 49,166 $ 95,956 $ 45,554 $ 34,930 $ 80,484
(1) FFELP category is primarily Stafford loans, but also includes federally insured PLUS and HEAL loans.
(2) On a Managed Basis, internal consolidations include FFELP student loans in securitization trusts that were consolidated back on-balance sheet. Such loans totaled $8.7
billion, $5.5 billion and $5.8 billion for the years ended December 31, 2005, 2004 and 2003 respectively.
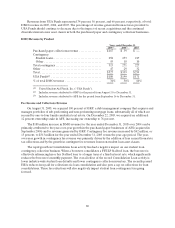
The increase in FFELP Stafford and other consolidations to third parties is primarily due to some
FFELP lenders consolidating these loans using the FDLP as a pass-through entity to circumvent the
statutory prohibition on the FFELP reconsolidation of FFELP Consolidation Loans. Recently passed
legislation eliminates this practice by June 30, 2006, but we are working with others in the industry to end it
before June 30, 2006 because we believe that it is improper and not permitted by current regulations. If
this practice is not ended before June 30, 2006, we expect to experience additional run-off of Consolidation
Loans to third parties through such time.