Sallie Mae 2005 Annual Report Download - page 191
Download and view the complete annual report
Please find page 191 of the 2005 Sallie Mae annual report below. You can navigate through the pages in the report by either clicking on the pages listed below, or by using the keyword search tool below to find specific information within the annual report.-
 1
1 -
2
-
3
-
4
-
5
-
6
-
7
-
8
-
9
-
10
-
11
-
12
-
13
-
14
-
15
-
16
-
17
-
18
-
19
-
20
-
21
-
22
-
23
-
24
-
25
-
26
-
27
-
28
-
29
-
30
-
31
-
32
-
33
-
34
-
35
-
36
-
37
-
38
-
39
-
40
-
41
-
42
-
43
-
44
-
45
-
46
-
47
-
48
-
49
-
50
-
51
-
52
-
53
-
54
-
55
-
56
-
57
-
58
-
59
-
60
-
61
-
62
-
63
-
64
-
65
-
66
-
67
-
68
-
69
-
70
-
71
-
72
-
73
-
74
-
75
-
76
-
77
-
78
-
79
-
80
-
81
-
82
-
83
-
84
-
85
-
86
-
87
-
88
-
89
-
90
-
91
-
92
-
93
-
94
-
95
-
96
-
97
-
98
-
99
-
100
-
101
-
102
-
103
-
104
-
105
-
106
-
107
-
108
-
109
-
110
-
111
-
112
-
113
-
114
-
115
-
116
-
117
-
118
-
119
-
120
-
121
-
122
-
123
-
124
-
125
-
126
-
127
-
128
-
129
-
130
-
131
-
132
-
133
-
134
-
135
-
136
-
137
-
138
-
139
-
140
-
141
-
142
-
143
-
144
-
145
-
146
-
147
-
148
-
149
-
150
-
151
-
152
-
153
-
154
-
155
-
156
-
157
-
158
-
159
-
160
-
161
-
162
-
163
-
164
-
165
-
166
-
167
-
168
-
169
-
170
-
171
-
172
-
173
-
174
-
175
-
176
-
177
-
178
-
179
-
180
-
 181
181 -
 182
182 -
 183
183 -
 184
184 -
 185
185 -
 186
186 -
 187
187 -
 188
188 -
 189
189 -
 190
190 -
 191
191 -
 192
192 -
 193
193 -
 194
194 -
 195
195 -
 196
196 -
 197
197 -
 198
198 -
 199
199 -
 200
200 -
 201
201 -
202
-
203
-
204
-
205
-
206
-
207
-
208
-
209
-
210
-
211
-
212
-
213
-
214
 |
 |

SLM CORPORATION
NOTES TO CONSOLIDATED FINANCIAL STATEMENTS (Continued)
(Dollars in thousands, except per share amounts, unless otherwise stated)
F-69
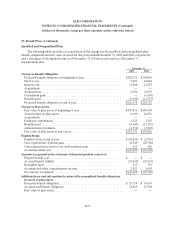
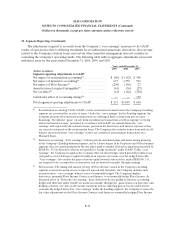
18. Segment Reporting (Continued)
“Core earnings” are the primary financial performance measures used by management to develop the
Company’s financial plans, track results, and establish corporate performance targets and incentive
compensation. Management believes this information provides additional insight into the financial
performance of the core business activities of its operating segments. Accordingly, the tables presented
below reflect “core earnings” operating measures reviewed and utilized by management to manage the
business. Reconciliation of the segment totals to the Company’s consolidated operating results in
accordance with GAAP are also included in the tables below.
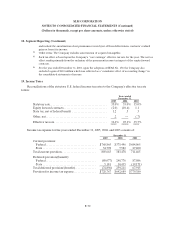
Segment Results and Reconciliations to GAAP
Year ended December 31, 2005
(Dollars in millions) Lending DMO
Corporate
and Other
Segment
Totals Adjustments
Total
GAAP
Interest income:
FFELP Stafford and Other Student Loans . . $ 2,298 $ — $ — $ 2,298 $ (1,283 ) $ 1,015
Consolidation Loans...................... 3,014 — — 3,014 (514 ) 2,500
Private Education Loans.................. 1,160 — — 1,160 (526 ) 634
Other loans.............................. 85 — — 85 — 85
Cash and investments..................... 401 — — 401 (125 ) 276
Total interestincome....................... 6,958 — — 6,958 (2,448 ) 4,510
Total interestexpense....................... 4,823 — — 4,823 (1,764 ) 3,059
Net interest income......................... 2,135 — — 2,135 (684 ) 1,451
Less: provisionsfor losses ................... 138 — — 138 65 203
Net interest income after provisions for losses . 1,997 — — 1,997 (749 ) 1,248
Fee income................................ — 360 115 475 — 475
Collections revenue ........................ — 167 — 167 — 167
Other income.............................. 110 — 126 236 1,129 1,365
Operating expenses......................... 479 283 308 1,070 68 1,138
Income tax expense (benefit)(1) ............... 602 91 (25) 668 61 729
Minority interest in net earnings of subsidiaries 2 4 — 6 — 6
Netincome(loss) .......................... $ 1,024 $ 149 $(42) $ 1,131 $ 251 $1,382
(1) Income taxes are based on a percentage of net income before tax for the individual reportable segments.