Sallie Mae 2005 Annual Report Download - page 78
Download and view the complete annual report
Please find page 78 of the 2005 Sallie Mae annual report below. You can navigate through the pages in the report by either clicking on the pages listed below, or by using the keyword search tool below to find specific information within the annual report.-
 1
1 -
2
-
3
-
4
-
5
-
6
-
7
-
8
-
9
-
10
-
11
-
12
-
13
-
14
-
15
-
16
-
17
-
18
-
19
-
20
-
21
-
22
-
23
-
24
-
25
-
26
-
27
-
28
-
29
-
30
-
31
-
32
-
33
-
34
-
35
-
36
-
37
-
38
-
39
-
40
-
41
-
42
-
43
-
44
-
45
-
46
-
47
-
48
-
49
-
50
-
51
-
52
-
53
-
54
-
55
-
56
-
57
-
58
-
59
-
60
-
61
-
62
-
63
-
64
-
65
-
66
-
67
-
 68
68 -
 69
69 -
 70
70 -
 71
71 -
 72
72 -
 73
73 -
 74
74 -
 75
75 -
 76
76 -
 77
77 -
 78
78 -
 79
79 -
 80
80 -
 81
81 -
 82
82 -
 83
83 -
 84
84 -
 85
85 -
 86
86 -
 87
87 -
 88
88 -
89
-
90
-
91
-
92
-
93
-
94
-
95
-
96
-
97
-
98
-
99
-
100
-
101
-
102
-
103
-
104
-
105
-
106
-
107
-
108
-
109
-
110
-
111
-
112
-
113
-
114
-
115
-
116
-
117
-
118
-
119
-
120
-
121
-
122
-
123
-
124
-
125
-
126
-
127
-
128
-
129
-
130
-
131
-
132
-
133
-
134
-
135
-
136
-
137
-
138
-
139
-
140
-
141
-
142
-
143
-
144
-
145
-
146
-
147
-
148
-
149
-
150
-
151
-
152
-
153
-
154
-
155
-
156
-
157
-
158
-
159
-
160
-
161
-
162
-
163
-
164
-
165
-
166
-
167
-
168
-
169
-
170
-
171
-
172
-
173
-
174
-
175
-
176
-
177
-
178
-
179
-
180
-
181
-
182
-
183
-
184
-
185
-
186
-
187
-
188
-
189
-
190
-
191
-
192
-
193
-
194
-
195
-
196
-
197
-
198
-
199
-
200
-
201
-
202
-
203
-
204
-
205
-
206
-
207
-
208
-
209
-
210
-
211
-
212
-
213
-
214
 |
 |

68
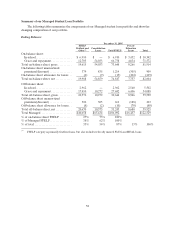
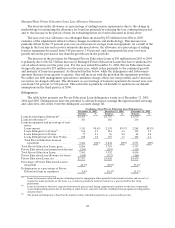
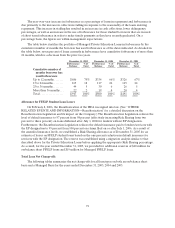
Managed Basis Private Education Loan Loss Allowance Discussion
The decrease in the allowance as a percentage of ending loans in repayment is due to the change in
methodology for estimating the allowance for loan loss primarily by reducing the loss confirmation period,
and to the increase in the period of time for estimating future recoveries discussed in detail above.
The year-over-year allowance on a Managed Basis increased by $52 million from 2004 to 2005,
exclusive of the adjustments related to these changes in estimate and methodology. This increase was
primarily driven by the 37 percent year-over-year increase in average loans in repayment. As a result of the
change in the loan loss and recovery estimates discussed above, the allowance as a percentage of ending
loans in repayment decreased from 5.08 percent to 3.40 percent, and consequently the year-over-year
growth rate in the provision is less than the growth rate in the portfolio.
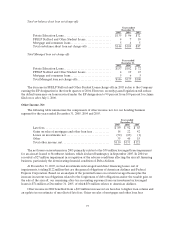
The increase in the provision for Managed Private Education Loans of $41 million from 2003 to 2004
is primarily due to the $2.3 billion increase in Managed Private Education Loans that have transitioned to
out-of-school status over the prior year. For the year ended December 31, 2004, Private Education Loan
charge-offs increased by $33 million over the prior year, which is due primarily to the continued growth
and maturity of loans in repayment. As discussed further below, while the delinquency and forbearance
amounts fluctuate from quarter to quarter, they will increase with the growth in the repayment portfolio.
We utilize our debt management operations to minimize charge-offs in our own portfolio and to increase
recoveries on charged-off loans. The allowance as a percentage of loans in repayment decreased year-over-
year from 5.86 percent to 5.08 percent. This reduction is primarily attributable to updates in our default
assumptions in the third quarter of 2004.
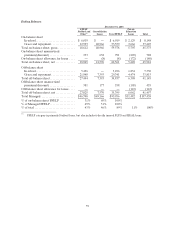
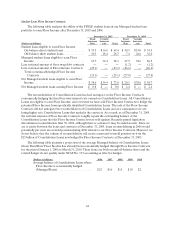
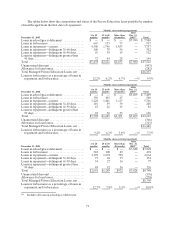
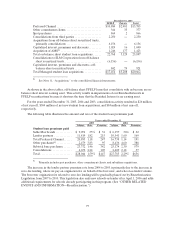
Delinquencies
The table below presents our Private Education Loan delinquency trends as of December 31, 2005,
2004 and 2003. Delinquencies have the potential to adversely impact earnings through increased servicing
and collection costs in the event the delinquent accounts charge off.
On-Balance Sheet Private Education Loan Delinquencies
December 31, 2005 December 31, 2004 December 31, 2003
Balance % Balance % Balance %
Loans in-school/grace/deferment(1)......... $ 4,301 $ 2,787 $ 1,970
Loans in forbearance(2) .................. 303 166 236
Loans in repayment and percentage of each
status:
Loanscurrent........................ 3,311 90.4% 2,555 89.9% 2,268 88.9%
Loans delinquent 31-60 days(3) .......... 166 4.5 124 4.4 115 4.5
Loans delinquent 61-90 days............ 77 2.1 56 2.0 62 2.4
Loans delinquent greater than 90 days . . . 108 3.0 107 3.7 106 4.2
Total Private Education Loans in
repayment......................... 3,662 100% 2,842 100 % 2,551 100%
Total Private Education Loans, gross....... 8,266 5,795 4,757
Private Education Loan unamortized discount (305) (203) (121 )
Total Private Education Loans ............ 7,961 5,592 4,636
Private Education Loan allowance for losses (204) (172) (166 )
Private Education Loans, net ............. $7,757 $5,420 $4,470
Percentage of Private Education Loans in
repayment ........................... 44.3% 49.0% 53.6 %
Delinquencies as a percentage of Private
Education Loans in repayment.......... 9.6% 10.1% 11.1 %
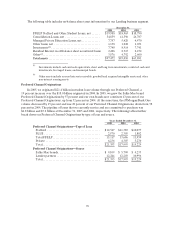
(1) Loans for borrowers who still may be attending school or engaging in other permitted educational activities and are not yet
required to make payments on the loans, e.g., residency periods for medical students or a grace period for bar exam
preparation.
(2) Loans for borrowers who have requested extension of grace period during employment transition or who have temporarily
ceased making full payments due to hardship or other factors, consistent with the established loan program servicing policies
and procedures.
(3) The period of delinquency is based on the number of days scheduled payments are contractually past due.