Sallie Mae 2005 Annual Report Download - page 108
Download and view the complete annual report
Please find page 108 of the 2005 Sallie Mae annual report below. You can navigate through the pages in the report by either clicking on the pages listed below, or by using the keyword search tool below to find specific information within the annual report.-
 1
1 -
2
-
3
-
4
-
5
-
6
-
7
-
8
-
9
-
10
-
11
-
12
-
13
-
14
-
15
-
16
-
17
-
18
-
19
-
20
-
21
-
22
-
23
-
24
-
25
-
26
-
27
-
28
-
29
-
30
-
31
-
32
-
33
-
34
-
35
-
36
-
37
-
38
-
39
-
40
-
41
-
42
-
43
-
44
-
45
-
46
-
47
-
48
-
49
-
50
-
51
-
52
-
53
-
54
-
55
-
56
-
57
-
58
-
59
-
60
-
61
-
62
-
63
-
64
-
65
-
66
-
67
-
68
-
69
-
70
-
71
-
72
-
73
-
74
-
75
-
76
-
77
-
78
-
79
-
80
-
81
-
82
-
83
-
84
-
85
-
86
-
87
-
88
-
89
-
90
-
91
-
92
-
93
-
94
-
95
-
96
-
97
-
 98
98 -
 99
99 -
 100
100 -
 101
101 -
 102
102 -
 103
103 -
 104
104 -
 105
105 -
 106
106 -
 107
107 -
 108
108 -
 109
109 -
 110
110 -
 111
111 -
 112
112 -
 113
113 -
 114
114 -
 115
115 -
 116
116 -
 117
117 -
 118
118 -
119
-
120
-
121
-
122
-
123
-
124
-
125
-
126
-
127
-
128
-
129
-
130
-
131
-
132
-
133
-
134
-
135
-
136
-
137
-
138
-
139
-
140
-
141
-
142
-
143
-
144
-
145
-
146
-
147
-
148
-
149
-
150
-
151
-
152
-
153
-
154
-
155
-
156
-
157
-
158
-
159
-
160
-
161
-
162
-
163
-
164
-
165
-
166
-
167
-
168
-
169
-
170
-
171
-
172
-
173
-
174
-
175
-
176
-
177
-
178
-
179
-
180
-
181
-
182
-
183
-
184
-
185
-
186
-
187
-
188
-
189
-
190
-
191
-
192
-
193
-
194
-
195
-
196
-
197
-
198
-
199
-
200
-
201
-
202
-
203
-
204
-
205
-
206
-
207
-
208
-
209
-
210
-
211
-
212
-
213
-
214
 |
 |

98
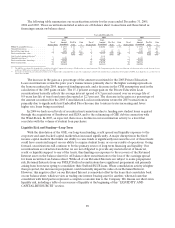
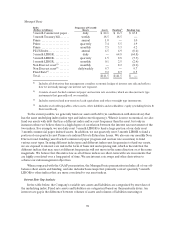
Managed Basis
Index
(Dollars in billions)
Frequency of Variable
Resets Assets Funding(1) Funding Gap
3 month Commercial paper . daily $ 82.1 $ 16.3 $ 65.8
3 month Treasurybill....... weekly 18.5 18.5 —
Prime .................... annual 1.0 — 1.0
Prime .................... quarterly 7.4 5.5 1.9
Prime .................... monthly 7.5 3.3 4.2
PLUS Index............... annual 4.5 4.9 (0.4)
3-month LIBOR........... daily — 64.8 (64.8)
3-month LIBOR........... quarterly 1.5 8.8 (7.3)
1-month LIBOR........... monthly 0.1 2.5 (2.4)
Non Discreet reset(2) ....... monthly — 8.2 (8.2)
Non Discreet reset(3) ....... daily/weekly 9.7 — 9.7
Fixed Rate(4) .............. 9.2 8.7 0.5
Total..................... $ 141.5 $ 141.5 $ —
(1) Includes all derivatives that management considers economic hedges of interest rate risk and reflects
how we internally manage our interest rate exposure.
(2) Consists of asset-backed commercial paper and auction rate securities, which are discount note type
instruments that generally roll over monthly.
(3) Includes restricted and non-restricted cash equivalents and other overnight type instruments.
(4) Includes receivables/payables, other assets, other liabilities and stockholders’ equity (excluding Series B
Preferred Stock).
To the extent possible, we generally fund our assets with debt (in combination with derivatives) that
has the same underlying index (index type and index reset frequency). When it is more economical, we also
fund our assets with debt that has a different index and/or reset frequency than the asset, but only in
instances where we believe there is a high degree of correlation between the interest rate movement of the
two indices. For example, we use daily reset 3-month LIBOR to fund a large portion of our daily reset
3-month commercial paper indexed assets. In addition, we use quarterly reset 3-month LIBOR to fund a
portion of our quarterly reset Prime rate indexed Private Education Loans. We also use our monthly Non
Discreet reset funding (asset-backed commercial paper program and auction rate securities) to fund
various asset types. In using different index types and different index reset frequencies to fund our assets,
we are exposed to interest rate risk in the form of basis risk and repricing risk, which is the risk that the
different indices that may reset at different frequencies will not move in the same direction or at the same
magnitude. We believe that this risk is low as all of these indices are short-term with rate movements that
are highly correlated over a long period of time. We use interest rate swaps and other derivatives to
achieve our risk management objectives.
When compared with the GAAP presentation, the Managed basis presentation includes all of our off-
balance sheet assets and funding, and also includes basis swaps that primarily convert quarterly 3-month
LIBOR to other indices that are more correlated to our asset indices.
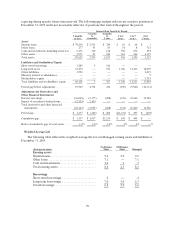
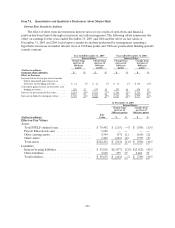
Interest Rate Gap Analysis
In the table below, the Company’s variable rate assets and liabilities are categorized by reset date of
the underlying index. Fixed rate assets and liabilities are categorized based on their maturity dates. An
interest rate gap is the difference between volumes of assets and volumes of liabilities maturing or