Sallie Mae 2005 Annual Report Download - page 45
Download and view the complete annual report
Please find page 45 of the 2005 Sallie Mae annual report below. You can navigate through the pages in the report by either clicking on the pages listed below, or by using the keyword search tool below to find specific information within the annual report.-
 1
1 -
2
-
3
-
4
-
5
-
6
-
7
-
8
-
9
-
10
-
11
-
12
-
13
-
14
-
15
-
16
-
17
-
18
-
19
-
20
-
21
-
22
-
23
-
24
-
25
-
26
-
27
-
28
-
29
-
30
-
31
-
32
-
33
-
34
-
 35
35 -
 36
36 -
 37
37 -
 38
38 -
 39
39 -
 40
40 -
 41
41 -
 42
42 -
 43
43 -
 44
44 -
 45
45 -
 46
46 -
 47
47 -
 48
48 -
 49
49 -
 50
50 -
 51
51 -
 52
52 -
 53
53 -
 54
54 -
 55
55 -
56
-
57
-
58
-
59
-
60
-
61
-
62
-
63
-
64
-
65
-
66
-
67
-
68
-
69
-
70
-
71
-
72
-
73
-
74
-
75
-
76
-
77
-
78
-
79
-
80
-
81
-
82
-
83
-
84
-
85
-
86
-
87
-
88
-
89
-
90
-
91
-
92
-
93
-
94
-
95
-
96
-
97
-
98
-
99
-
100
-
101
-
102
-
103
-
104
-
105
-
106
-
107
-
108
-
109
-
110
-
111
-
112
-
113
-
114
-
115
-
116
-
117
-
118
-
119
-
120
-
121
-
122
-
123
-
124
-
125
-
126
-
127
-
128
-
129
-
130
-
131
-
132
-
133
-
134
-
135
-
136
-
137
-
138
-
139
-
140
-
141
-
142
-
143
-
144
-
145
-
146
-
147
-
148
-
149
-
150
-
151
-
152
-
153
-
154
-
155
-
156
-
157
-
158
-
159
-
160
-
161
-
162
-
163
-
164
-
165
-
166
-
167
-
168
-
169
-
170
-
171
-
172
-
173
-
174
-
175
-
176
-
177
-
178
-
179
-
180
-
181
-
182
-
183
-
184
-
185
-
186
-
187
-
188
-
189
-
190
-
191
-
192
-
193
-
194
-
195
-
196
-
197
-
198
-
199
-
200
-
201
-
202
-
203
-
204
-
205
-
206
-
207
-
208
-
209
-
210
-
211
-
212
-
213
-
214
 |
 |
35
probable net credit losses. The maturing of our Private Education Loan portfolios has provided us with
more historical data on borrower default behavior such that we now analyze those portfolios to determine
the effects that the various stages of delinquency have on borrower default behavior and ultimate charge-
off. As a result, in the second quarter of 2005, we changed our estimate of the allowance for loan losses for
our Managed loan portfolio to include a migration analysis of delinquent and current accounts, in addition
to other considerations. A migration analysis is a technique used to estimate the likelihood that a loan
receivable may progress through the various delinquency stages and ultimately charge-off, and is a widely
used reserving methodology in the consumer finance industry. Previously, we calculated the allowance for
Private Education Loan losses by estimating the probable losses in the portfolio based primarily on loan
characteristics and where pools of loans were in their life, with less emphasis on current delinquency status
of the loan. Also, in our prior methodology for calculating the allowance, some Private Education Loan
loss rates were based on proxies and extrapolations of FFELP loan loss data.
We also transitioned to a migration analysis to revise our estimated losses associated with accrued
interest income. Under the new methodology, we estimate the amount of uncollectible accrued interest on
Private Education Loans and write it off against current period interest income. Under our prior
methodology, Private Education Loans continued to accrue interest, even during periods of forbearance,
until they were charged off, at which time, the loans were placed on non-accrual status and all previously
accrued interest was reversed against income in the month of charge-off. The allowance for loan losses
provided for a portion of the probable losses in accrued interest receivable prior to charge-off.
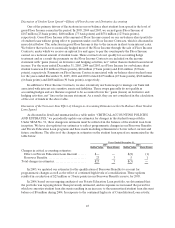
This change in reserving methodology has been accounted for as a change in estimate in accordance
with the Accounting Principles Board (“APB”) Opinion No. 20, “Accounting Changes.” The effect of this
change in estimate was to increase the allowance by $40 million and to reduce student loan interest income
for the estimate of uncollectible accrued interest receivable by $14 million. On the income statement,
adjustments to the allowance are recorded through the provisions for losses whereas adjustments to
accrued interest are recorded in interest income.
When calculating the Private Education Loan loss reserve, we divide the portfolio into categories of
similar risk characteristics based on loan program type, loan status (in-school, grace, repayment,
forbearance, delinquency), underwriting criteria, existence or absence of a co-borrower, and aging. We
then apply default and collection rate projections to each category. Our higher education Private
Education Loan programs (89 percent of the Managed Private Education Loan portfolio at December 31,
2005) do not require the borrowers to begin repayment until six months after they have graduated or
otherwise left school. Consequently, our loss estimates for these programs are minimal while the borrower
is in school. Our career training and alternative Private Education Loan programs (11 percent of the
Managed Private Education Loan portfolio at December 31, 2005) generally require the borrowers to start
repaying their loans immediately. At December 31, 2005, 46 percent of the principal balance in the higher
education Managed Private Education Loan portfolio related to borrowers who are still in-school and not
required to make payments. As the current portfolio ages, an increasing percentage of the borrowers will
leave school and be required to begin payments on their loans. The allowance for losses will change
accordingly with the percentage of borrowers in repayment.
Our loss estimates include losses to be incurred generally over a two year loss confirmation period.
Similar to the rules governing FFELP payment requirements, our collection policies allow for periods of
nonpayment for borrowers requesting additional payment grace periods upon leaving school or
experiencing temporary difficulty meeting payment obligations. This is referred to as forbearance status.
The majority of forbearance occurs early in the repayment term when borrowers are starting their careers
(see “LENDING BUSINESS SEGMENT—Private Education Loans—Delinquencies”). At December 31,
2005, 10 percent of the Managed Private Education Loan portfolio in repayment and forbearance was in
forbearance status. The loss confirmation period is in alignment with our typical collection cycle and takes
into account these periods of nonpayment.