Sallie Mae 2005 Annual Report Download - page 113
Download and view the complete annual report
Please find page 113 of the 2005 Sallie Mae annual report below. You can navigate through the pages in the report by either clicking on the pages listed below, or by using the keyword search tool below to find specific information within the annual report.-
 1
1 -
2
-
3
-
4
-
5
-
6
-
7
-
8
-
9
-
10
-
11
-
12
-
13
-
14
-
15
-
16
-
17
-
18
-
19
-
20
-
21
-
22
-
23
-
24
-
25
-
26
-
27
-
28
-
29
-
30
-
31
-
32
-
33
-
34
-
35
-
36
-
37
-
38
-
39
-
40
-
41
-
42
-
43
-
44
-
45
-
46
-
47
-
48
-
49
-
50
-
51
-
52
-
53
-
54
-
55
-
56
-
57
-
58
-
59
-
60
-
61
-
62
-
63
-
64
-
65
-
66
-
67
-
68
-
69
-
70
-
71
-
72
-
73
-
74
-
75
-
76
-
77
-
78
-
79
-
80
-
81
-
82
-
83
-
84
-
85
-
86
-
87
-
88
-
89
-
90
-
91
-
92
-
93
-
94
-
95
-
96
-
97
-
98
-
99
-
100
-
101
-
102
-
 103
103 -
 104
104 -
 105
105 -
 106
106 -
 107
107 -
 108
108 -
 109
109 -
 110
110 -
 111
111 -
 112
112 -
 113
113 -
 114
114 -
 115
115 -
 116
116 -
 117
117 -
 118
118 -
 119
119 -
 120
120 -
 121
121 -
 122
122 -
 123
123 -
124
-
125
-
126
-
127
-
128
-
129
-
130
-
131
-
132
-
133
-
134
-
135
-
136
-
137
-
138
-
139
-
140
-
141
-
142
-
143
-
144
-
145
-
146
-
147
-
148
-
149
-
150
-
151
-
152
-
153
-
154
-
155
-
156
-
157
-
158
-
159
-
160
-
161
-
162
-
163
-
164
-
165
-
166
-
167
-
168
-
169
-
170
-
171
-
172
-
173
-
174
-
175
-
176
-
177
-
178
-
179
-
180
-
181
-
182
-
183
-
184
-
185
-
186
-
187
-
188
-
189
-
190
-
191
-
192
-
193
-
194
-
195
-
196
-
197
-
198
-
199
-
200
-
201
-
202
-
203
-
204
-
205
-
206
-
207
-
208
-
209
-
210
-
211
-
212
-
213
-
214
 |
 |

103
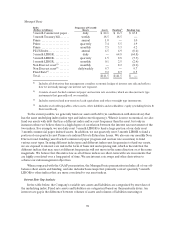
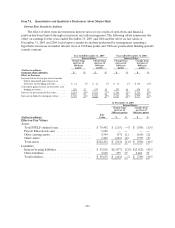
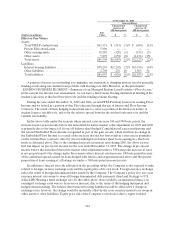
Item 7A. Quantitative and Qualitative Disclosures About Market Risk
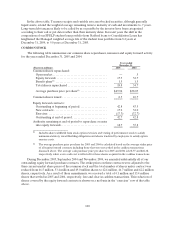
Interest Rate Sensitivity Analysis
The effect of short-term movements in interest rates on our results of operations and financial
position has been limited through our interest rate risk management. The following tables summarize the
effect on earnings for the years ended December 31, 2005 and 2004 and the effect on fair values at
December 31, 2005 and 2004, based upon a sensitivity analysis performed by management assuming a
hypothetical increase in market interest rates of 100 basis points and 300 basis points while funding spreads
remain constant.
Year ended December 31, 2005 Year ended December 31, 2004
Interest Rates: Interest Rates:
Change from
increase of
100 basis
points
Change from
increase of
300 basis
points
Change from
increase of
100 basis
points
Change from
increase of
300 basis
points
(Dollars in millions,
except per share amounts) $ % $ % $ % $ %
Effect on Earnings
Increase/(decrease) in pre-tax net income
before unrealized gains (losses) on
derivative and hedging activities ......... $ 12 1% $ 14 1% $ 31 3 % $138 14%
Unrealized gains (losses) on derivative and
hedging activities..................... 202 32 347 55 279 18 576 37
Increase in net income before taxes ........ $ 214 10% $ 361 17% $ 310 12 % $ 714 28%
Increase in diluted earnings per share ...... $ .323 11% $ .580 19% $ .424 10 % $ .975 24%
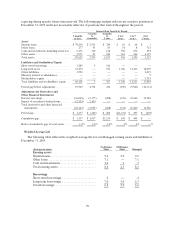
At December 31, 2005
Interest Rates:
Change from
increase of
100 basis points
Change from
increase of
300 basis points
(Dollars in millions)
Fair
Value $ % $ %
Effect on Fair Values
Assets
Total FFELPstudent loans........................ $ 76,492 $ (215) —% $ (385) (1)%
Private Education Loans.......................... 9,189 — — — —
Other earning assets.............................. 9,344 (57) (1) (164) (2)
Otherassets..................................... 7,429 (292) (4) (377) (5)
Totalassets...................................... $102,454 $ (564) (1)% $ (926) (1)%
Liabilities
Interest bearing liabilities ......................... $ 92,026 $(1,437) (2)% $(3,612) (4)%
Otherliabilities.................................. 3,609 975 27 2,863 79
Totalliabilities................................... $ 95,635 $ (462) —% $ (749) (1)%