Sallie Mae 2005 Annual Report Download - page 52
Download and view the complete annual report
Please find page 52 of the 2005 Sallie Mae annual report below. You can navigate through the pages in the report by either clicking on the pages listed below, or by using the keyword search tool below to find specific information within the annual report.-
 1
1 -
2
-
3
-
4
-
5
-
6
-
7
-
8
-
9
-
10
-
11
-
12
-
13
-
14
-
15
-
16
-
17
-
18
-
19
-
20
-
21
-
22
-
23
-
24
-
25
-
26
-
27
-
28
-
29
-
30
-
31
-
32
-
33
-
34
-
35
-
36
-
37
-
38
-
39
-
40
-
41
-
 42
42 -
 43
43 -
 44
44 -
 45
45 -
 46
46 -
 47
47 -
 48
48 -
 49
49 -
 50
50 -
 51
51 -
 52
52 -
 53
53 -
 54
54 -
 55
55 -
 56
56 -
 57
57 -
 58
58 -
 59
59 -
 60
60 -
 61
61 -
 62
62 -
63
-
64
-
65
-
66
-
67
-
68
-
69
-
70
-
71
-
72
-
73
-
74
-
75
-
76
-
77
-
78
-
79
-
80
-
81
-
82
-
83
-
84
-
85
-
86
-
87
-
88
-
89
-
90
-
91
-
92
-
93
-
94
-
95
-
96
-
97
-
98
-
99
-
100
-
101
-
102
-
103
-
104
-
105
-
106
-
107
-
108
-
109
-
110
-
111
-
112
-
113
-
114
-
115
-
116
-
117
-
118
-
119
-
120
-
121
-
122
-
123
-
124
-
125
-
126
-
127
-
128
-
129
-
130
-
131
-
132
-
133
-
134
-
135
-
136
-
137
-
138
-
139
-
140
-
141
-
142
-
143
-
144
-
145
-
146
-
147
-
148
-
149
-
150
-
151
-
152
-
153
-
154
-
155
-
156
-
157
-
158
-
159
-
160
-
161
-
162
-
163
-
164
-
165
-
166
-
167
-
168
-
169
-
170
-
171
-
172
-
173
-
174
-
175
-
176
-
177
-
178
-
179
-
180
-
181
-
182
-
183
-
184
-
185
-
186
-
187
-
188
-
189
-
190
-
191
-
192
-
193
-
194
-
195
-
196
-
197
-
198
-
199
-
200
-
201
-
202
-
203
-
204
-
205
-
206
-
207
-
208
-
209
-
210
-
211
-
212
-
213
-
214
 |
 |

42
valuation of our liability for Floor Income Contracts and to gains on our equity forward contracts caused
by the increase in the market value of our common stock. In 2004, other income (which includes guarantor
servicing fees, debt management fees and collections revenue, and other fee-based income) increased by
18 percent to $749 million versus 2003. This increase can mainly be attributed to an increase in revenue
from our DMO segment, late and other borrower fees and to termination fees from Bank One. In 2003,
other income benefited from a $40 million gain on the sale of our prior headquarters building. The year-
over-year increases in other income were offset by $369 million in lower securitization gains due to 2004
Consolidation Loan securitizations not qualifying for off-balance sheet treatment and $106 million in lower
servicing and securitization revenue due primarily to lower Embedded Floor Income.
Net income in 2004 was also negatively impacted by a $221 million pre-tax loss related to the
repurchase and defeasance of $3.0 billion of GSE debt in connection with the GSE Wind-Down and a
13 percent increase in other operating expenses to $895 million versus 2003. This increase can be
attributed to acquisitions and increased servicing and debt management expenses consistent with the
growth in borrowers and the growth in the debt management business. Also, in 2004, net interest income
after provisions for loan losses was relatively flat versus 2003 caused by two offsetting factors: the increase
in net interest income, driven by an $11 billion increase in our average balance of on-balance sheet student
loans, and offset by the reduction in Floor Income caused by higher interest rates.
Our Managed student loan portfolio grew by $18.6 billion, from $88.8 billion at December 31, 2003 to
$107.4 billion at December 31, 2004. This growth was fueled by the $29.9 billion in new Managed student
loans acquired in 2004, a 45 percent increase over the $20.7 billion acquired in 2003. In 2004, we originated
$18.0 billion of student loans through our Preferred Channel, an increase of 18 percent over the $15.2
billion originated in 2003.
NET INTEREST INCOME
Net interest income, including interest income and interest expense, is derived primarily from our
portfolio of student loans that remain on-balance sheet and to a lesser extent from other loans, cash and
investments. The “Taxable Equivalent Net Interest Income” analysis below is designed to facilitate a
comparison of non-taxable asset yields to taxable yields on a similar basis. Additional information
regarding the return on our student loan portfolio is set forth under “Student Loans—Student Loan Spread
Analysis—On-Balance Sheet.” Information regarding the provisions for losses is contained in Note 4 to the
consolidated financial statements, “Allowance for Student Loan Losses.”
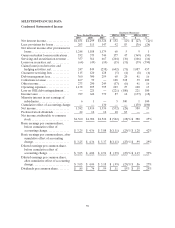
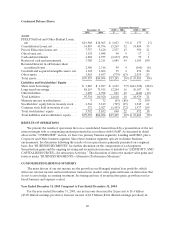
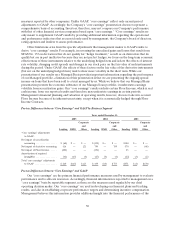
Taxable Equivalent Net Interest Income
The amounts in the following table are adjusted for the impact of certain tax-exempt and tax-
advantaged investments based on the marginal federal corporate tax rate of 35 percent.
Increase (decrease)
Years ended December 31, 2005 vs. 2004 2004 vs. 2003
2005 2004 2003 $ % $ %
Interest income
Studentloans........................ $4,149 $2,426 $2,121 $1,723 71 % $305 14%
Otherloans.......................... 85 74 77 11 15 (3) (4)
Cashandinvestments................. 277 233 150 44 19 83 55
Taxable equivalent adjustment......... 5 9 16 (4) (44 ) (7) (44)
Total taxable equivalent interest income . . 4,516 2,742 2,364 1,774 65 378 16
Interestexpense........................ 3,059 1,434 1,022 1,625 113 412 40
Taxable equivalent net interest income.... $1,457 $1,308 $1,342 $ 149 11% $ (34) (3)%