Sallie Mae 2005 Annual Report Download - page 131
Download and view the complete annual report
Please find page 131 of the 2005 Sallie Mae annual report below. You can navigate through the pages in the report by either clicking on the pages listed below, or by using the keyword search tool below to find specific information within the annual report.-
 1
1 -
2
-
3
-
4
-
5
-
6
-
7
-
8
-
9
-
10
-
11
-
12
-
13
-
14
-
15
-
16
-
17
-
18
-
19
-
20
-
21
-
22
-
23
-
24
-
25
-
26
-
27
-
28
-
29
-
30
-
31
-
32
-
33
-
34
-
35
-
36
-
37
-
38
-
39
-
40
-
41
-
42
-
43
-
44
-
45
-
46
-
47
-
48
-
49
-
50
-
51
-
52
-
53
-
54
-
55
-
56
-
57
-
58
-
59
-
60
-
61
-
62
-
63
-
64
-
65
-
66
-
67
-
68
-
69
-
70
-
71
-
72
-
73
-
74
-
75
-
76
-
77
-
78
-
79
-
80
-
81
-
82
-
83
-
84
-
85
-
86
-
87
-
88
-
89
-
90
-
91
-
92
-
93
-
94
-
95
-
96
-
97
-
98
-
99
-
100
-
101
-
102
-
103
-
104
-
105
-
106
-
107
-
108
-
109
-
110
-
111
-
112
-
113
-
114
-
115
-
116
-
117
-
118
-
119
-
120
-
 121
121 -
 122
122 -
 123
123 -
 124
124 -
 125
125 -
 126
126 -
 127
127 -
 128
128 -
 129
129 -
 130
130 -
 131
131 -
 132
132 -
 133
133 -
 134
134 -
 135
135 -
 136
136 -
 137
137 -
 138
138 -
 139
139 -
 140
140 -
 141
141 -
142
-
143
-
144
-
145
-
146
-
147
-
148
-
149
-
150
-
151
-
152
-
153
-
154
-
155
-
156
-
157
-
158
-
159
-
160
-
161
-
162
-
163
-
164
-
165
-
166
-
167
-
168
-
169
-
170
-
171
-
172
-
173
-
174
-
175
-
176
-
177
-
178
-
179
-
180
-
181
-
182
-
183
-
184
-
185
-
186
-
187
-
188
-
189
-
190
-
191
-
192
-
193
-
194
-
195
-
196
-
197
-
198
-
199
-
200
-
201
-
202
-
203
-
204
-
205
-
206
-
207
-
208
-
209
-
210
-
211
-
212
-
213
-
214
 |
 |

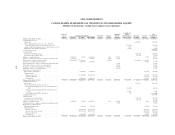
See accompanying notes to consolidated financial statements.
F-9
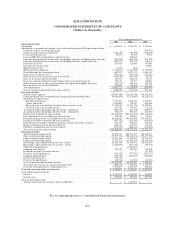
SLM CORPORATION
CONSOLIDATED STATEMENTS OF CASH FLOWS
(Dollars in thousands)
Years Ended December 31,
2005 2004 2003
Operating activities
Netincome.............................................................. $ 1,382,284 $ 1,913,270 $ 1,533,560
Adjustments to reconcile net income to net cash (used in) provided by operating activities:
Cumulative effect of accounting change ...................................... — — (129,971)
Gains on student loan securitizations ........................................ (552,546) (375,384) (744,289)
Loss on investments, net.................................................. 63,955 49,358 9,932
Loss on GSE debtextinguishment and defeasance .............................. — 220,848 —
Unrealized (gains)/losses on derivative and hedging activities, excluding equity forwards . (514,362) (802,548 ) (570,189)
Unrealized (gains)/losses on derivative and hedging activities—equity forwards ........ (120,433) (759,423) 68,233
Provisions for losses ..................................................... 203,006 111,066 147,480
Donation of treasury stock ................................................ — — 40,000
Minority interest, net..................................................... (7,835) (502) —
Mortgage loans originated................................................. (1,746,986) (1,461,979) (1,577,094)
Proceeds from sales of mortgage loans ....................................... 1,692,923 1,257,574 1,565,343
(Increase) in restricted cash................................................ (972,321) (791,176) (123,222)
(Increase) decrease in accrued interest receivable ............................... (788,819) (467,745) 29,130
Increase in accrued interest payable ......................................... 260,505 162,018 94,474
Decrease in Retained Interest in off-balance sheet securitized loans, net ............. 258,351 85,767 96,000
(Increase) decrease in other assets, goodwill and acquired intangible assets, net ........ (111,217) 596,101 321,799
Increase (decrease) in other liabilities ........................................ 254,668 (54,461) 132,378
Total adjustments....................................................... (2,081,111) (2,230,486) (639,996)
Net cash (used in) provided by operating activities .............................. (698,827) (317,216) 893,564
Investing activities
Student loans acquired ................................................... (29,347,428) (22,673,926) (18,318,703)
Loans purchased from securitized trusts (primarily loan consolidations) .............. (9,491,668) (5,552,467) (6,156,521)
Reduction of student loans:
Installment payments................................................... 7,477,455 5,020,214 3,857,285
Claims and resales ..................................................... 1,025,686 798,327 645,966
Proceeds from securitization of student loans treated as sales .................... 13,520,208 12,475,726 13,482,900
Proceeds from sales of student loans ....................................... 167,410 478,402 38,362
Academic facilities financings and other loans—originated ........................ (565,070) (403,156) (380,957)
Academic facilities financings and other loans—repayments ....................... 523,473 593,261 627,585
Purchases of available-for-sale securities ...................................... (66,318,067) (292,943,325) (275,412,837)
Proceeds from sales of available-for-sale securities .............................. 983,469 124,205 10,505
Proceeds from maturities of available-for-sale securities .......................... 66,336,065 293,743,096 274,274,563
Purchases of held-to-maturity and other securities .............................. (903,328) (292,330) (304,491)
Proceeds from maturities of held-to-maturity securities and other securities ........... 904,179 275,567 279,176
Return of investment from Retained Interest .................................. 256,712 449,539 315,610
Purchase of subsidiaries, net of cash acquired .................................. (237,919) (868,404) (113,614)
Net cash used in investing activities .......................................... (15,668,823) (8,775,271) (7,155,171)
Financing activities
Short-term borrowings issued .............................................. 59,820,213 290,974,707 764,160,787
Short-term borrowings repaid .............................................. (59,907,574) (298,108,496) (772,657,799)
Long-term borrowings issued .............................................. 10,267,396 15,456,903 19,330,222
Long-term borrowings repaid .............................................. (5,732,752) (15,826,730) (18,658,436)
Borrowings collateralized by loans in trust—issued .............................. 12,913,991 21,584,931 16,442,305
Borrowings collateralized by loans in trust—activity ............................. (1,448,270) (653,177) (96,774)
GSE debt extinguishment ................................................. — (1,967,607) —
Common stock issued.................................................... 270,315 289,965 339,296
Premiums on equity forward contracts........................................ — — (17,361)
Common stock repurchased ............................................... (732,342) (777,293) (917,353)
Common dividends paid.................................................. (355,368) (321,313) (266,882)
Preferred stock issued.................................................... 396,745 — —
Preferred dividends paid.................................................. (21,536) (11,501) (11,501)
Net cash provided by financing activities ...................................... 15,470,818 10,640,389 7,646,504
Net (decrease) increase in cash and cash equivalents............................. (896,832) 1,547,902 1,384,897
Cash and cash equivalents at beginning of year ................................. 3,395,487 1,847,585 462,688
Cash and cash equivalents at end of year ....................................... $ 2,498,655 $ 3,395,487 $ 1,847,585
Cash disbursements made for:
Interest ............................................................... $ 2,587,582 $ 1,214,249 $ 930,619
Income taxes ........................................................... $ 476,923 $ 549,319 $ 655,796
Noncash financing activity:
Transfer of investments to trust to defease GSE debt ............................ $ — $ 1,305,906 $ —