Sallie Mae 2005 Annual Report Download - page 94
Download and view the complete annual report
Please find page 94 of the 2005 Sallie Mae annual report below. You can navigate through the pages in the report by either clicking on the pages listed below, or by using the keyword search tool below to find specific information within the annual report.-
 1
1 -
2
-
3
-
4
-
5
-
6
-
7
-
8
-
9
-
10
-
11
-
12
-
13
-
14
-
15
-
16
-
17
-
18
-
19
-
20
-
21
-
22
-
23
-
24
-
25
-
26
-
27
-
28
-
29
-
30
-
31
-
32
-
33
-
34
-
35
-
36
-
37
-
38
-
39
-
40
-
41
-
42
-
43
-
44
-
45
-
46
-
47
-
48
-
49
-
50
-
51
-
52
-
53
-
54
-
55
-
56
-
57
-
58
-
59
-
60
-
61
-
62
-
63
-
64
-
65
-
66
-
67
-
68
-
69
-
70
-
71
-
72
-
73
-
74
-
75
-
76
-
77
-
78
-
79
-
80
-
81
-
82
-
83
-
 84
84 -
 85
85 -
 86
86 -
 87
87 -
 88
88 -
 89
89 -
 90
90 -
 91
91 -
 92
92 -
 93
93 -
 94
94 -
 95
95 -
 96
96 -
 97
97 -
 98
98 -
 99
99 -
 100
100 -
 101
101 -
 102
102 -
 103
103 -
 104
104 -
105
-
106
-
107
-
108
-
109
-
110
-
111
-
112
-
113
-
114
-
115
-
116
-
117
-
118
-
119
-
120
-
121
-
122
-
123
-
124
-
125
-
126
-
127
-
128
-
129
-
130
-
131
-
132
-
133
-
134
-
135
-
136
-
137
-
138
-
139
-
140
-
141
-
142
-
143
-
144
-
145
-
146
-
147
-
148
-
149
-
150
-
151
-
152
-
153
-
154
-
155
-
156
-
157
-
158
-
159
-
160
-
161
-
162
-
163
-
164
-
165
-
166
-
167
-
168
-
169
-
170
-
171
-
172
-
173
-
174
-
175
-
176
-
177
-
178
-
179
-
180
-
181
-
182
-
183
-
184
-
185
-
186
-
187
-
188
-
189
-
190
-
191
-
192
-
193
-
194
-
195
-
196
-
197
-
198
-
199
-
200
-
201
-
202
-
203
-
204
-
205
-
206
-
207
-
208
-
209
-
210
-
211
-
212
-
213
-
214
 |
 |

84
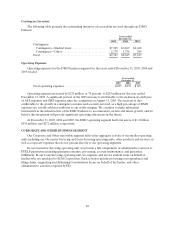
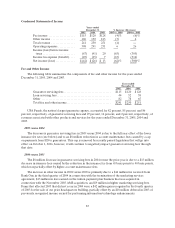
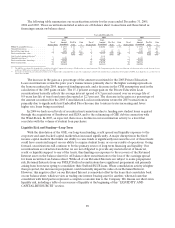
Operating Expenses
The following table summarizes the components of operating expenses for our Corporate and Other
operating segment.
Years ended
December 31,
2005 2004 2003
Operatingexpenses ...................................... $149 $152 $107
Generalandadministrativeexpenses....................... 159 139 124
Totaloperatingexpenses.................................. $308 $291 $231
Operating expenses include direct costs incurred to service loans for unrelated third parties and to
perform guarantor servicing on behalf of guarantor agencies, as well as information technology expenses
related to these functions. General and administrative expenses include unallocated corporate overhead
expenses for centralized headquarters functions such as executive management, accounting and finance,
human resources and marketing.
2005 versus 2004
The increase in general and administrative expenses in 2005 versus 2004 was primarily due to a
$14 million net settlement in the College Loan Corporation (“CLC”) lawsuit.
2004 versus 2003
The 12 percent increase in general and administrative expenses from 2003 to 2004 is primarily due to
the growth in the business and additional administrative costs related to compliance with the Sarbanes-
Oxley Act of 2002. We also incurred additional expenses related to AMS, acquired in December of 2003,
primarily to manage the tuition payment plan product.
At December 31, 2005, 2004 and 2003, the Corporate and Other operating segment had total assets of
$719 million, $524 million, and $447 million, respectively.
LIQUIDITY AND CAPITAL RESOURCES
Except in the case of acquisitions, which are discussed separately, our DMO and Corporate and Other
business segments are not capital intensive businesses and as such a minimal amount of debt and equity
capital is allocated to these segments. Therefore, the following liquidity and capital resource discussion is
concentrated on our Lending business segment.
We depend on the debt capital markets to support our business plan. We have developed deep and
diverse funding sources to ensure continued access to funding now that the GSE has been dissolved. Our
biggest funding challenge going forward is to maintain cost effective liquidity to fund the growth in the
Managed portfolio of student loans as well as to refinance previously securitized loans when borrowers
choose to refinance their loans through a Consolidation Loan with the Company. At the same time, we
must maintain earnings spreads by controlling interest rate risk. Our main source of funding is student loan
securitizations and we have built a highly liquid market for such financings as evidenced by the
$26.1 billion in student loans securitized in twelve transactions in 2005, and $33.8 billion in thirteen
transactions, including the amount funded through our asset-backed commercial paper program
(“ABCP”) transaction in 2004. We are the largest issuer in the student loan asset-backed sector. FFELP
securitizations are unique securities in the asset-backed market and are backed by student loans with an
explicit guarantee on 100 percent of principal and interest. This guarantee is subject to service compliance
and the amount guaranteed will be lowered to 99 percent after July 1, 2006 through legislation (see
“OTHER RELATED EVENTS AND INFORMATION—Reauthorization”). As evidenced by the