Sallie Mae 2005 Annual Report Download - page 156
Download and view the complete annual report
Please find page 156 of the 2005 Sallie Mae annual report below. You can navigate through the pages in the report by either clicking on the pages listed below, or by using the keyword search tool below to find specific information within the annual report.-
 1
1 -
2
-
3
-
4
-
5
-
6
-
7
-
8
-
9
-
10
-
11
-
12
-
13
-
14
-
15
-
16
-
17
-
18
-
19
-
20
-
21
-
22
-
23
-
24
-
25
-
26
-
27
-
28
-
29
-
30
-
31
-
32
-
33
-
34
-
35
-
36
-
37
-
38
-
39
-
40
-
41
-
42
-
43
-
44
-
45
-
46
-
47
-
48
-
49
-
50
-
51
-
52
-
53
-
54
-
55
-
56
-
57
-
58
-
59
-
60
-
61
-
62
-
63
-
64
-
65
-
66
-
67
-
68
-
69
-
70
-
71
-
72
-
73
-
74
-
75
-
76
-
77
-
78
-
79
-
80
-
81
-
82
-
83
-
84
-
85
-
86
-
87
-
88
-
89
-
90
-
91
-
92
-
93
-
94
-
95
-
96
-
97
-
98
-
99
-
100
-
101
-
102
-
103
-
104
-
105
-
106
-
107
-
108
-
109
-
110
-
111
-
112
-
113
-
114
-
115
-
116
-
117
-
118
-
119
-
120
-
121
-
122
-
123
-
124
-
125
-
126
-
127
-
128
-
129
-
130
-
131
-
132
-
133
-
134
-
135
-
136
-
137
-
138
-
139
-
140
-
141
-
142
-
143
-
144
-
145
-
 146
146 -
 147
147 -
 148
148 -
 149
149 -
 150
150 -
 151
151 -
 152
152 -
 153
153 -
 154
154 -
 155
155 -
 156
156 -
 157
157 -
 158
158 -
 159
159 -
 160
160 -
 161
161 -
 162
162 -
 163
163 -
 164
164 -
 165
165 -
 166
166 -
167
-
168
-
169
-
170
-
171
-
172
-
173
-
174
-
175
-
176
-
177
-
178
-
179
-
180
-
181
-
182
-
183
-
184
-
185
-
186
-
187
-
188
-
189
-
190
-
191
-
192
-
193
-
194
-
195
-
196
-
197
-
198
-
199
-
200
-
201
-
202
-
203
-
204
-
205
-
206
-
207
-
208
-
209
-
210
-
211
-
212
-
213
-
214
 |
 |

SLM CORPORATION
NOTES TO CONSOLIDATED FINANCIAL STATEMENTS (Continued)
(Dollars in thousands, except per share amounts, unless otherwise stated)
F-34
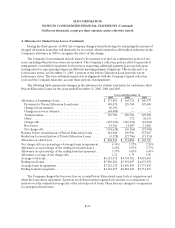
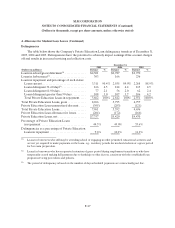
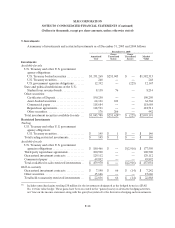
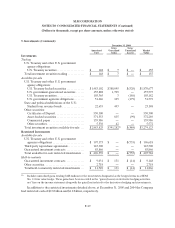
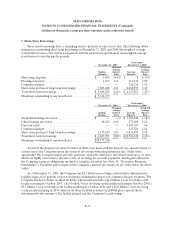
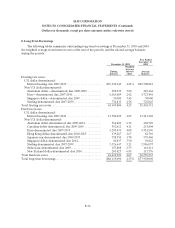
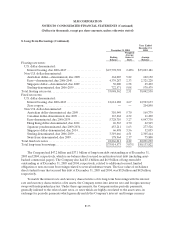
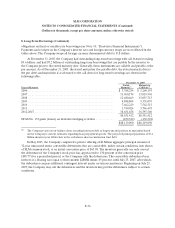
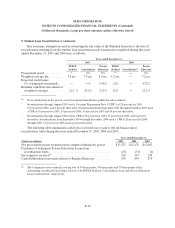
8. Long-Term Borrowings
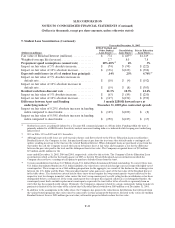
The following tables summarize outstanding long-term borrowings at December 31, 2005 and 2004,
the weighted average stated interest rates at the end of the periods, and the related average balances
during the periods.
December 31, 2005
Year Ended
December 31,
2005
Ending
Balance
Weighted
Average
Interest
Rate
Average
Balance
Floating rate notes:
U.S. dollar denominated:
Interest bearing, due2007-2047......................... $56,340,243 4.41% $49,708,841
Non U.S. dollar denominated:
Australian dollar—denominated, due 2009-2010.......... 389,035 5.98 210,264
Euro—denominated, due 2007-2041..................... 6,165,689 2.42 4,727,401
Singapore dollar—denominated, due 2009 ............... 30,000 3.45 30,000
Sterling-denominated,due2007-2039.................... 774,833 4.78 725,025
Total floatingrate notes.................................... 63,699,800 4.23 55,401,531
Fixed rate notes:
U.S. dollar denominated:
Interest bearing, due2007-2043......................... 13,396,025 4.87 13,211,202
Non U.S. dollar denominated:
Australian dollar-denominated, due 2009-2012............ 566,402 6.34 402,749
Canadian dollar-denominated, due 2009-2010 ............ 552,612 4.11 251,804
Euro-denominated, due 2007-2039...................... 5,293,439 4.08 4,714,596
HongKong dollar-denominated, due 2010-2015........... 139,267 4.67 82,710
Japanese yen-denominated, due 2009-2035 ............... 728,350 1.78 575,460
Singapore dollar-denominated, due 2014................. 60,837 3.90 58,822
Sterling-denominated,due2007-2039.................... 3,326,647 5.21 2,986,037
Swiss franc-denominated, due 2009...................... 153,888 2.75 161,411
New Zealand dollar-denominated, due 2010.............. 201,823 6.85 111,776
Total fixed rate notes ...................................... 24,419,290 4.67 22,556,567
Total long-term borrowings................................. $88,119,090 4.35% $77,958,098