Sallie Mae 2005 Annual Report Download - page 152
Download and view the complete annual report
Please find page 152 of the 2005 Sallie Mae annual report below. You can navigate through the pages in the report by either clicking on the pages listed below, or by using the keyword search tool below to find specific information within the annual report.-
 1
1 -
2
-
3
-
4
-
5
-
6
-
7
-
8
-
9
-
10
-
11
-
12
-
13
-
14
-
15
-
16
-
17
-
18
-
19
-
20
-
21
-
22
-
23
-
24
-
25
-
26
-
27
-
28
-
29
-
30
-
31
-
32
-
33
-
34
-
35
-
36
-
37
-
38
-
39
-
40
-
41
-
42
-
43
-
44
-
45
-
46
-
47
-
48
-
49
-
50
-
51
-
52
-
53
-
54
-
55
-
56
-
57
-
58
-
59
-
60
-
61
-
62
-
63
-
64
-
65
-
66
-
67
-
68
-
69
-
70
-
71
-
72
-
73
-
74
-
75
-
76
-
77
-
78
-
79
-
80
-
81
-
82
-
83
-
84
-
85
-
86
-
87
-
88
-
89
-
90
-
91
-
92
-
93
-
94
-
95
-
96
-
97
-
98
-
99
-
100
-
101
-
102
-
103
-
104
-
105
-
106
-
107
-
108
-
109
-
110
-
111
-
112
-
113
-
114
-
115
-
116
-
117
-
118
-
119
-
120
-
121
-
122
-
123
-
124
-
125
-
126
-
127
-
128
-
129
-
130
-
131
-
132
-
133
-
134
-
135
-
136
-
137
-
138
-
139
-
140
-
141
-
 142
142 -
 143
143 -
 144
144 -
 145
145 -
 146
146 -
 147
147 -
 148
148 -
 149
149 -
 150
150 -
 151
151 -
 152
152 -
 153
153 -
 154
154 -
 155
155 -
 156
156 -
 157
157 -
 158
158 -
 159
159 -
 160
160 -
 161
161 -
 162
162 -
163
-
164
-
165
-
166
-
167
-
168
-
169
-
170
-
171
-
172
-
173
-
174
-
175
-
176
-
177
-
178
-
179
-
180
-
181
-
182
-
183
-
184
-
185
-
186
-
187
-
188
-
189
-
190
-
191
-
192
-
193
-
194
-
195
-
196
-
197
-
198
-
199
-
200
-
201
-
202
-
203
-
204
-
205
-
206
-
207
-
208
-
209
-
210
-
211
-
212
-
213
-
214
 |
 |

SLM CORPORATION
NOTES TO CONSOLIDATED FINANCIAL STATEMENTS (Continued)
(Dollars in thousands, except per share amounts, unless otherwise stated)
F-30
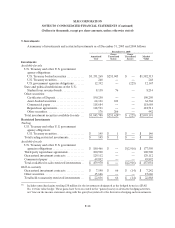
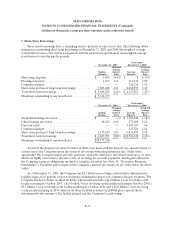
5. Investments (Continued)
As of December 31, 2005 and 2004, $141 million and $178 million of the net unrealized gain (after
tax) related to available-for-sale investments was included in accumulated other comprehensive income. Of
the total available-for-sale securities outstanding as of December 31, 2005, $666 million (fair value) has
been pledged as collateral.
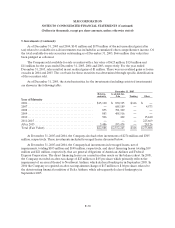
The Company sold available-for-sale securities with a fair value of $625 million, $124 million and
$11 million for the years ended December 31, 2005, 2004 and 2003, respectively. For the year ended
December 31, 2005, sales resulted in net realized gains of $1 million. There were no realized gains or losses
on sales in 2004 and 2003. The cost basis for these securities was determined through specific identification
of the securities sold.
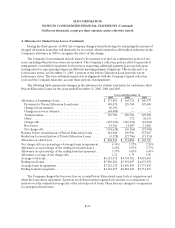
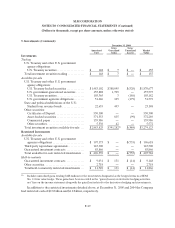
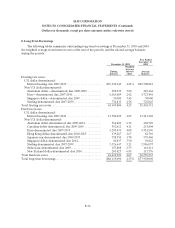
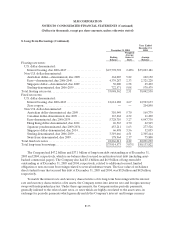
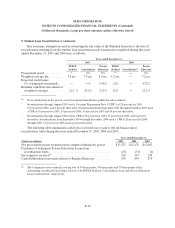
As of December 31, 2005, the stated maturities for the investments (including restricted investments)
are shown in the following table:
December 31, 2005
Held-to-
maturity
Available-for-
Sale Trading Other
Year of Maturity
2006............................................... $ 15,140 $ 870,315 $ 146 $ —
2007............................................... — 688,189 — 4,573
2008............................................... 873 391,309 — —
2009............................................... 883 408,516 — —
2010............................................... 506 442 — 15,440
2011-2015.......................................... — — — 225,669
After 2015.......................................... 5,486 193,474 — 28,126
Total (Fair Value)................................... $22,888 $2,552,245 $146 $273,808
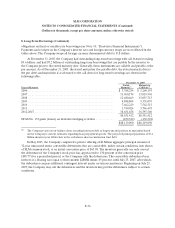
At December 31, 2005 and 2004, the Company also had other investments of $274 million and $305
million, respectively. These investments included leveraged leases discussed below.
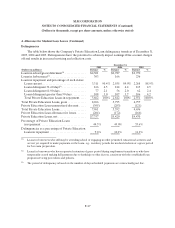
At December 31, 2005 and 2004, the Company had investments in leveraged leases, net of
impairments, totaling $103 million and $148 million, respectively, and direct financing leases totaling $19
million and $21 million, respectively, that are general obligations of American Airlines and Federal
Express Corporation. The direct financing leases are carried in other assets on the balance sheet. In 2005,
the Company recorded an after-tax charge of $25 million or $.05 per share which primarily reflects the
impairment of an aircraft leased to Northwest Airlines, which declared bankruptcy in September 2005. In
2004 the Company recognized an after-tax impairment charge of $17 million or $.04 per share related to
the deteriorating financial condition of Delta Airlines, which subsequently declared bankruptcy in
September 2005.