Sallie Mae 2005 Annual Report Download - page 77
Download and view the complete annual report
Please find page 77 of the 2005 Sallie Mae annual report below. You can navigate through the pages in the report by either clicking on the pages listed below, or by using the keyword search tool below to find specific information within the annual report.-
 1
1 -
2
-
3
-
4
-
5
-
6
-
7
-
8
-
9
-
10
-
11
-
12
-
13
-
14
-
15
-
16
-
17
-
18
-
19
-
20
-
21
-
22
-
23
-
24
-
25
-
26
-
27
-
28
-
29
-
30
-
31
-
32
-
33
-
34
-
35
-
36
-
37
-
38
-
39
-
40
-
41
-
42
-
43
-
44
-
45
-
46
-
47
-
48
-
49
-
50
-
51
-
52
-
53
-
54
-
55
-
56
-
57
-
58
-
59
-
60
-
61
-
62
-
63
-
64
-
65
-
66
-
 67
67 -
 68
68 -
 69
69 -
 70
70 -
 71
71 -
 72
72 -
 73
73 -
 74
74 -
 75
75 -
 76
76 -
 77
77 -
 78
78 -
 79
79 -
 80
80 -
 81
81 -
 82
82 -
 83
83 -
 84
84 -
 85
85 -
 86
86 -
 87
87 -
88
-
89
-
90
-
91
-
92
-
93
-
94
-
95
-
96
-
97
-
98
-
99
-
100
-
101
-
102
-
103
-
104
-
105
-
106
-
107
-
108
-
109
-
110
-
111
-
112
-
113
-
114
-
115
-
116
-
117
-
118
-
119
-
120
-
121
-
122
-
123
-
124
-
125
-
126
-
127
-
128
-
129
-
130
-
131
-
132
-
133
-
134
-
135
-
136
-
137
-
138
-
139
-
140
-
141
-
142
-
143
-
144
-
145
-
146
-
147
-
148
-
149
-
150
-
151
-
152
-
153
-
154
-
155
-
156
-
157
-
158
-
159
-
160
-
161
-
162
-
163
-
164
-
165
-
166
-
167
-
168
-
169
-
170
-
171
-
172
-
173
-
174
-
175
-
176
-
177
-
178
-
179
-
180
-
181
-
182
-
183
-
184
-
185
-
186
-
187
-
188
-
189
-
190
-
191
-
192
-
193
-
194
-
195
-
196
-
197
-
198
-
199
-
200
-
201
-
202
-
203
-
204
-
205
-
206
-
207
-
208
-
209
-
210
-
211
-
212
-
213
-
214
 |
 |

67
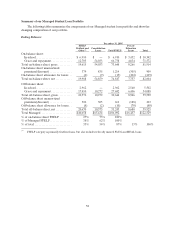
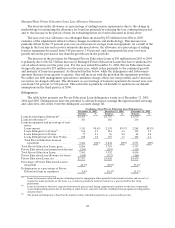
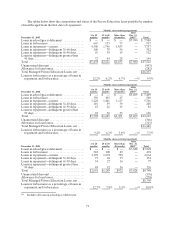
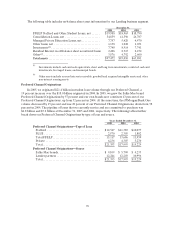
The following table summarizes changes in the allowance for Private Education Loan losses for the
years ended December 31, 2005, 2004 and 2003.
Activity in Allowance for Private Education Loans
On-Balance Sheet Off-Balance Sheet Managed Basis
Years ended Years ended Years ended
Dec. 31,
2005
Dec. 31,
2004
Dec. 31,
2003
Dec. 31,
2005
Dec. 31,
2004
Dec. 31,
2003
Dec. 31,
2005
Dec. 31,
2004
Dec. 31,
2003
Allowance at beginning of period. $ 172 $ 166 $ 181 $ 143 $ 93 $ 13 $ 315 $ 259 $ 194
Provision for Private Education
Loan losses............. 186 130 107 3 28 10 189 158 117
Changeinlossestimate...... 40 — — (60) — — (20) — —
Change in recovery estimate. . . (49) — — (16) — — (65) — —
Total provision............ 177 130 107 (73) 28 10 104 158 117
Other................... — — 21 — — (1) — — 20
Charge-offs............... (154 ) (110) (83) (2) (6) — (156 ) (116 ) (83)
Recoveries ............... 19 14 11 — — — 19 14 11
Net charge-offs ............ (135 ) (96) (72) (2) (6) — (137 ) (102 ) (72)
Balance before securitization of
Private Education Loans .... 214 200 237 68 115 22 282 315 259
Securitization of Private Education
Loans .................. (10) (28) (71) 10 28 71 — — —
Allowance atend of period..... $ 204 $ 172 $ 166 $ 78 $ 143 $ 93 $ 282 $ 315 $ 259
Net charge-offs as a percentage of
average loans in repayment
(annualized) ............. 4.14% 3.57% 2.59% .07% .22% —% 1.89% 1.92 % 1.85%
Allowance as a percentage of the
ending total loan balance .... 2.56 % 3.07% 3.57% .89% 2.31% 2.37% 1.69 % 2.67 % 3.02%
Allowance as a percentage of
ending loans in repayment . . . 5.57 % 6.05% 6.50% 1.68% 4.27% 4.99% 3.40 % 5.08 % 5.86%
Average coverage of net
charge-offs(annualized)..... 1.52 1.79 2.30 29.75 24.81 — 2.06 3.09 3.60
Average total loans ........... $6,922 $ 4,795 $ 5,018 $ 7,238 $ 5,495 $ 2,284 $ 14,160 $ 10,290 $ 7,303
Ending total loans............ $7,961 $ 5,592 $ 4,636 $ 8,758 $ 6,205 $ 3,928 $ 16,719 $ 11,797 $ 8,564
Average loans in repayment..... $3,252 $ 2,697 $ 2,772 $ 4,002 $ 2,611 $ 1,116 $ 7,254 $ 5,307 $ 3,888
Ending loans in repayment ..... $3,662 $ 2,842 $ 2,551 $ 4,653 $ 3,352 $ 1,870 $ 8,315 $ 6,194 $ 4,421
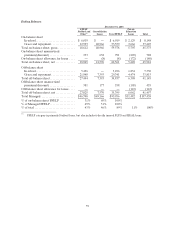
On-Balance Sheet versus Managed Presentation
All Private Education Loans are initially acquired on-balance sheet. When we securitize Private
Education Loans, we no longer legally own the loans and they are accounted for off-balance sheet. For our
Managed presentation in the table above, we reduce the on-balance sheet allowance for amounts
previously provided and then provide for these loans in the off-balance sheet section with the total of both
on and off-balance sheet residing in the Managed presentation.
When Private Education Loans in the majority of our securitized trusts become 180 days delinquent,
we typically exercise our contingent call option to repurchase these loans at par value out of the trust and
record a loss for the difference in the par value paid and the fair market value of the loan at the time of
purchase. If these loans reach the 212-day delinquency, a charge-off for the remaining balance of the loan
is triggered. On a Managed Basis, the losses recorded under GAAP for loans repurchased at day 180 are
reversed and the full amount is charged-off at day 212.
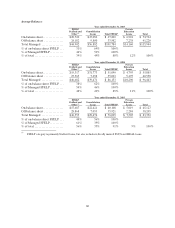
The off-balance sheet allowance is increasing as more loans are securitized but is lower than the on-
balance sheet percentage when measured as a percentage of ending loans in repayment because of the
different mix of loans on-balance sheet and off-balance sheet, as described above. Additionally, a larger
percentage of the off-balance sheet loan borrowers are still in-school status and not required to make
payments on their loans. Once repayment begins, the allowance requirements increase to reflect the
increased risk of loss as loans enter repayment.