Sallie Mae 2005 Annual Report Download - page 59
Download and view the complete annual report
Please find page 59 of the 2005 Sallie Mae annual report below. You can navigate through the pages in the report by either clicking on the pages listed below, or by using the keyword search tool below to find specific information within the annual report.-
 1
1 -
2
-
3
-
4
-
5
-
6
-
7
-
8
-
9
-
10
-
11
-
12
-
13
-
14
-
15
-
16
-
17
-
18
-
19
-
20
-
21
-
22
-
23
-
24
-
25
-
26
-
27
-
28
-
29
-
30
-
31
-
32
-
33
-
34
-
35
-
36
-
37
-
38
-
39
-
40
-
41
-
42
-
43
-
44
-
45
-
46
-
47
-
48
-
 49
49 -
 50
50 -
 51
51 -
 52
52 -
 53
53 -
 54
54 -
 55
55 -
 56
56 -
 57
57 -
 58
58 -
 59
59 -
 60
60 -
 61
61 -
 62
62 -
 63
63 -
 64
64 -
 65
65 -
 66
66 -
 67
67 -
 68
68 -
 69
69 -
70
-
71
-
72
-
73
-
74
-
75
-
76
-
77
-
78
-
79
-
80
-
81
-
82
-
83
-
84
-
85
-
86
-
87
-
88
-
89
-
90
-
91
-
92
-
93
-
94
-
95
-
96
-
97
-
98
-
99
-
100
-
101
-
102
-
103
-
104
-
105
-
106
-
107
-
108
-
109
-
110
-
111
-
112
-
113
-
114
-
115
-
116
-
117
-
118
-
119
-
120
-
121
-
122
-
123
-
124
-
125
-
126
-
127
-
128
-
129
-
130
-
131
-
132
-
133
-
134
-
135
-
136
-
137
-
138
-
139
-
140
-
141
-
142
-
143
-
144
-
145
-
146
-
147
-
148
-
149
-
150
-
151
-
152
-
153
-
154
-
155
-
156
-
157
-
158
-
159
-
160
-
161
-
162
-
163
-
164
-
165
-
166
-
167
-
168
-
169
-
170
-
171
-
172
-
173
-
174
-
175
-
176
-
177
-
178
-
179
-
180
-
181
-
182
-
183
-
184
-
185
-
186
-
187
-
188
-
189
-
190
-
191
-
192
-
193
-
194
-
195
-
196
-
197
-
198
-
199
-
200
-
201
-
202
-
203
-
204
-
205
-
206
-
207
-
208
-
209
-
210
-
211
-
212
-
213
-
214
 |
 |

49
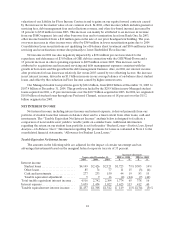
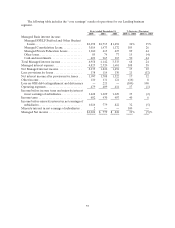
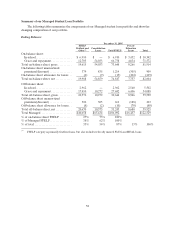
Year ended December 31, 2003
Lending DMO
Corporate
and Other
Managed interest income:
Managed FFELP Stafford and Other Student Loans.................. $1,494 $ — $ —
Managed Consolidation Loans..................................... 1,172 — —
Managed Private Education Loans................................. 427 — —
Other loans...................................................... 77 — —
Cash and investments............................................... 163 — —
Total Managed interest income...................................... 3,333 — —
Managed interest expense........................................... 1,681 — —
Net interest income................................................. 1,652 — —
Less: provisionsfor losses ........................................... 130 — —
Net interest income after provisions for losses ......................... 1,522 — —
Fee income........................................................ — 259 128
Other income...................................................... 121 — 123
Operating expenses................................................. 414 123 231
Income tax expense(1) ............................................... 407 45 7
Cumulative effect of accounting change ............................... — — —
Managed net income ............................................... $ 822 $ 91 $ 13
(1) Income taxes are based on a percentage of net income before tax for the individual reportable segment.
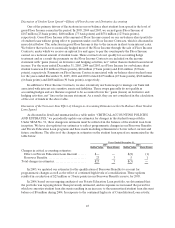
Alternative Performance Measures
In accordance with the Rules and Regulations of the Securities and Exchange Commission (“SEC”),
we prepare financial statements in accordance with GAAP. In addition to evaluating the Company’s
GAAP-based financial information, management evaluates the Company’s business segments under
certain non-GAAP performance measures that we refer to as “core earnings” for each business segment,
and we refer to this information in our presentations with credit rating agencies and lenders. While “core
earnings” are not a substitute for reported results under GAAP, we rely on “core earnings” to manage
each operating segment because we believe these measures provide additional information regarding the
operational and performance indicators that are most closely assessed by management.
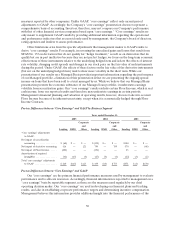
Our “core earnings” are the primary financial performance measures used by management to evaluate
performance and to allocate resources. Accordingly, financial information is reported to management on a
“core earnings” basis by reportable segment, as these are the measures used regularly by our chief
operating decision maker. Our “core earnings” are used in developing our financial plans and tracking
results, and also in establishing corporate performance targets and determining incentive compensation.
Management believes this information provides additional insight into the financial performance of the
Company’s core business activities. Our “core earnings” are not defined terms within GAAP and may not
be comparable to similarly titled measures reported by other companies. “Core earnings” reflect only
current period adjustments to GAAP as described below. Accordingly, the Company’s “core earnings”
presentation does not represent another comprehensive basis of accounting. A more detailed discussion of
the differences between GAAP and “core earnings” follows.
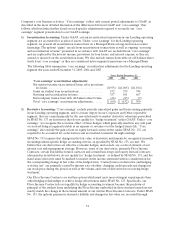
Limitations of “Core Earnings”
While GAAP provides a uniform, comprehensive basis of accounting, for the reasons described above,
management believes that “core earnings” are an important additional tool for providing a more complete
understanding of the Company’s results of operations. Nevertheless, “core earnings” are subject to certain
general and specific limitations that investors should carefully consider. For example, as stated above,
unlike financial accounting, there is no comprehensive, authoritative guidance for management reporting.
Our “core earnings” are not defined terms within GAAP and may not be comparable to similarly titled