Sallie Mae 2005 Annual Report Download - page 89
Download and view the complete annual report
Please find page 89 of the 2005 Sallie Mae annual report below. You can navigate through the pages in the report by either clicking on the pages listed below, or by using the keyword search tool below to find specific information within the annual report.-
 1
1 -
2
-
3
-
4
-
5
-
6
-
7
-
8
-
9
-
10
-
11
-
12
-
13
-
14
-
15
-
16
-
17
-
18
-
19
-
20
-
21
-
22
-
23
-
24
-
25
-
26
-
27
-
28
-
29
-
30
-
31
-
32
-
33
-
34
-
35
-
36
-
37
-
38
-
39
-
40
-
41
-
42
-
43
-
44
-
45
-
46
-
47
-
48
-
49
-
50
-
51
-
52
-
53
-
54
-
55
-
56
-
57
-
58
-
59
-
60
-
61
-
62
-
63
-
64
-
65
-
66
-
67
-
68
-
69
-
70
-
71
-
72
-
73
-
74
-
75
-
76
-
77
-
78
-
 79
79 -
 80
80 -
 81
81 -
 82
82 -
 83
83 -
 84
84 -
 85
85 -
 86
86 -
 87
87 -
 88
88 -
 89
89 -
 90
90 -
 91
91 -
 92
92 -
 93
93 -
 94
94 -
 95
95 -
 96
96 -
 97
97 -
 98
98 -
 99
99 -
100
-
101
-
102
-
103
-
104
-
105
-
106
-
107
-
108
-
109
-
110
-
111
-
112
-
113
-
114
-
115
-
116
-
117
-
118
-
119
-
120
-
121
-
122
-
123
-
124
-
125
-
126
-
127
-
128
-
129
-
130
-
131
-
132
-
133
-
134
-
135
-
136
-
137
-
138
-
139
-
140
-
141
-
142
-
143
-
144
-
145
-
146
-
147
-
148
-
149
-
150
-
151
-
152
-
153
-
154
-
155
-
156
-
157
-
158
-
159
-
160
-
161
-
162
-
163
-
164
-
165
-
166
-
167
-
168
-
169
-
170
-
171
-
172
-
173
-
174
-
175
-
176
-
177
-
178
-
179
-
180
-
181
-
182
-
183
-
184
-
185
-
186
-
187
-
188
-
189
-
190
-
191
-
192
-
193
-
194
-
195
-
196
-
197
-
198
-
199
-
200
-
201
-
202
-
203
-
204
-
205
-
206
-
207
-
208
-
209
-
210
-
211
-
212
-
213
-
214
 |
 |

79
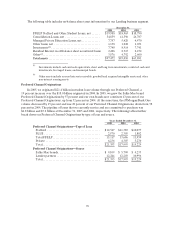
The private sector collections industry is highly fragmented with few large public companies and a
large number of small scale privately-held companies. The collections industry is highly competitive with
credit card collections being the most competitive in both contingency collections and purchased paper
activities. We are responding to these competitive challenges through enhanced servicing efficiencies and
by continuing to build on customer relationships through value added services.
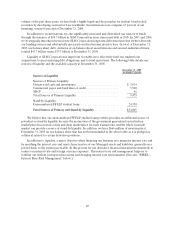
In the purchased receivables business, we focus on a variety of consumer debt types with emphasis on
charged off credit card receivables and distressed mortgage receivables. We purchase these portfolios at a
discount to their face value, and then use both our internal collections operations coupled with third party
collection agencies to maximize the recovery on these receivables. A major success factor in the purchased
receivables business is the ability to effectively price the portfolios. We conduct both quantitative and
qualitative analysis to appropriately price each portfolio to yield a return consistent with DMO financial
targets.
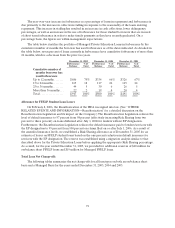
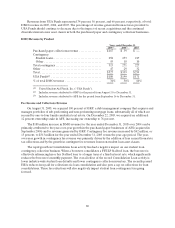
We account for our investments in charged off receivables in accordance with the AICPA’s Statement
of Position (“SOP”) 03-3, “Accounting for Certain Loans or Debt Securities Acquired in a Transfer.”
Under this standard, we establish static pools of relatively homogeneous accounts and initially record them
at fair value. Under SOP 03-3, the yield that may be accreted as interest income on such loans is limited to
the excess of our estimate of undiscounted expected principal, interest and other cash flows from the loan
over our initial investment in the loan. We recognize income each month based on each static pool’s
effective interest rate. Subsequent increases in estimated future cash flows are recognized prospectively
through a yield adjustment over the remaining life of the static pool. Decreases in estimated future cash
flows to be collected are recognized as an impairment expense. We record impairments to purchased
receivable assets when the actual yield on a pool of portfolios is less than the expected yield based on the
cash flows generated by the pool. The pools consist of portfolios of like kind assets.
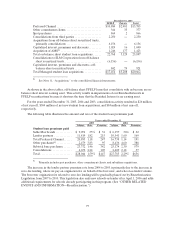
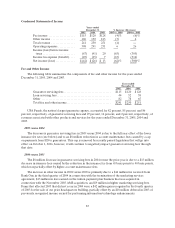
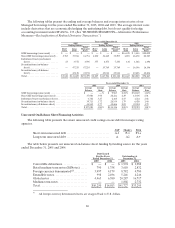
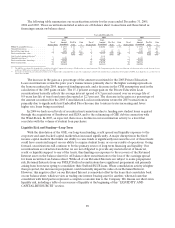
The following table includes the results of operations for our DMO operating segment.
Condensed Statements of Income
Years ended
December 31, % Increase (Decrease)
2005 2004 2003 2005 vs. 2004 2004 vs. 2003
Feeincome.................................... $360 $300 $259 20% 16%
Collections revenue ............................ 167 39 — 328 100
Totalrevenue.................................. 527 339 259 55 31
Operatingexpenses............................. 283 159 123 78 29
Income before income taxes and minority interest in
net earnings of subsidiaries.................... 244 180 136 36 32
Incometaxes .................................. 91 65 45 40 44
Income before minority interest in net earnings of
subsidiaries.................................. 153 115 91 33 26
Minority interest innet earningsofsubsidiaries .... 4 1 — 300 100
Netincome.................................... $149 $114 $ 91 31% 25%