Sallie Mae 2005 Annual Report Download - page 101
Download and view the complete annual report
Please find page 101 of the 2005 Sallie Mae annual report below. You can navigate through the pages in the report by either clicking on the pages listed below, or by using the keyword search tool below to find specific information within the annual report.-
 1
1 -
2
-
3
-
4
-
5
-
6
-
7
-
8
-
9
-
10
-
11
-
12
-
13
-
14
-
15
-
16
-
17
-
18
-
19
-
20
-
21
-
22
-
23
-
24
-
25
-
26
-
27
-
28
-
29
-
30
-
31
-
32
-
33
-
34
-
35
-
36
-
37
-
38
-
39
-
40
-
41
-
42
-
43
-
44
-
45
-
46
-
47
-
48
-
49
-
50
-
51
-
52
-
53
-
54
-
55
-
56
-
57
-
58
-
59
-
60
-
61
-
62
-
63
-
64
-
65
-
66
-
67
-
68
-
69
-
70
-
71
-
72
-
73
-
74
-
75
-
76
-
77
-
78
-
79
-
80
-
81
-
82
-
83
-
84
-
85
-
86
-
87
-
88
-
89
-
90
-
 91
91 -
 92
92 -
 93
93 -
 94
94 -
 95
95 -
 96
96 -
 97
97 -
 98
98 -
 99
99 -
 100
100 -
 101
101 -
 102
102 -
 103
103 -
 104
104 -
 105
105 -
 106
106 -
 107
107 -
 108
108 -
 109
109 -
 110
110 -
 111
111 -
112
-
113
-
114
-
115
-
116
-
117
-
118
-
119
-
120
-
121
-
122
-
123
-
124
-
125
-
126
-
127
-
128
-
129
-
130
-
131
-
132
-
133
-
134
-
135
-
136
-
137
-
138
-
139
-
140
-
141
-
142
-
143
-
144
-
145
-
146
-
147
-
148
-
149
-
150
-
151
-
152
-
153
-
154
-
155
-
156
-
157
-
158
-
159
-
160
-
161
-
162
-
163
-
164
-
165
-
166
-
167
-
168
-
169
-
170
-
171
-
172
-
173
-
174
-
175
-
176
-
177
-
178
-
179
-
180
-
181
-
182
-
183
-
184
-
185
-
186
-
187
-
188
-
189
-
190
-
191
-
192
-
193
-
194
-
195
-
196
-
197
-
198
-
199
-
200
-
201
-
202
-
203
-
204
-
205
-
206
-
207
-
208
-
209
-
210
-
211
-
212
-
213
-
214
 |
 |

91
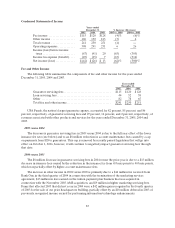
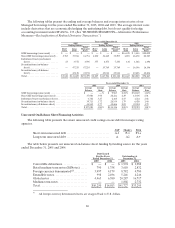
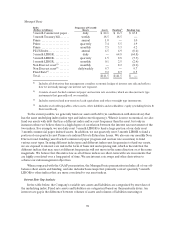
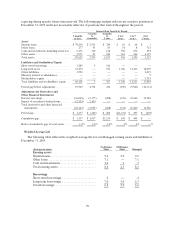
The following table summarizes the components of servicing and securitization revenue for the years
ended December 31, 2005, 2004 and 2003.
Years ended December 31,
2005 2004 2003
Servicingrevenue ............................................. $ 323 $ 326 $ 314
Securitization revenue, before Embedded Floor
Income and impairment...................................... 270 230 269
Servicing and securitization revenue, before
Embedded Floor Income and impairment ...................... 593 556 583
Embedded Floor Income....................................... 81 241 337
Less: Floor Income previously recognized in
gain calculation............................................. (57) (156) (157)
Net Embedded Floor Income ................................... 24 85 180
Servicing andsecuritizationrevenue, before impairment ........... 617 641 763
Retained Interest impairment................................... (260) (80) (96)
Total servicing and securitization revenue........................ $ 357 $ 561 $ 667
Average off-balance sheet student loans.......................... $41,220 $40,558 $ 38,205
Average balance of Retained Interest ............................ $ 2,476 $ 2,434 $ 2,615
Servicing and securitization revenue as a percentage of the average
balance of off-balance sheet student loans (annualized).......... .87% 1.38% 1.74%
Servicing and securitization revenue is primarily driven by the average balance of off-balance sheet
student loans and the amount of and the difference in the timing of Embedded Floor Income recognition
on off-balance sheet student loans. Servicing and securitization revenue can also be negatively impacted by
impairments of the value of our Retained Interest, caused primarily by the effect of higher than expected
Consolidation Loan activity on FFELP Stafford/PLUS student loan securitizations and the effect of
market interest rates on the Embedded Floor Income included in the Retained Interest. When loans in a
securitization trust consolidate, they are a prepayment to the trust resulting in a shorter average life. We
use a CPR assumption to estimate the effect of trust prepayments from loan consolidation and other
factors on the life of the trust. When consolidation activity is higher than forecasted, the Residual Interest
asset can be impaired and the yield used to recognize subsequent income from the trust is negatively
impacted. The majority of the consolidations bring the loans back on-balance sheet so for those loans we
retain the value of the asset on-balance sheet versus in the trust. For the years ended December 31, 2005,
2004 and 2003, we recorded impairments to the Retained Interests of $260 million, $80 million and $96
million, respectively. The impairment charge in 2005 was primarily caused by the effect of record levels of
consolidation activity as well as the increase of expected future CPR assumptions used to value the
Residual Interest. This surge in Consolidation Loan activity was due to FFELP Stafford borrowers locking
in lower interest rates by consolidating their loans prior to the July 1 interest rate reset for FFELP Stafford
loans. The level and timing of Consolidation Loan activity is highly volatile, and in response we continue to
revise our estimates of the effects of Consolidation Loan activity on our Retained Interests and it may
result in additional impairment recorded in future periods if Consolidation Loan activity remains higher
than projected. Our FFELP Retained Interests were also impaired by $23 million to account for the effect
of the one percent Risk Sharing loss applied to student loans receiving the EP designation. The increase in
Risk Sharing was included in legislation reauthorizing the Higher Education Act (see “OTHER
RELATED EVENTS AND INFORMATION—Reauthorization”). See “LENDING BUSINESS
SEGMENT—Allowance for FFELP Student Loans” for further discussion regarding the change in the
Risk Sharing exposure.