Sallie Mae 2005 Annual Report Download - page 148
Download and view the complete annual report
Please find page 148 of the 2005 Sallie Mae annual report below. You can navigate through the pages in the report by either clicking on the pages listed below, or by using the keyword search tool below to find specific information within the annual report.-
 1
1 -
2
-
3
-
4
-
5
-
6
-
7
-
8
-
9
-
10
-
11
-
12
-
13
-
14
-
15
-
16
-
17
-
18
-
19
-
20
-
21
-
22
-
23
-
24
-
25
-
26
-
27
-
28
-
29
-
30
-
31
-
32
-
33
-
34
-
35
-
36
-
37
-
38
-
39
-
40
-
41
-
42
-
43
-
44
-
45
-
46
-
47
-
48
-
49
-
50
-
51
-
52
-
53
-
54
-
55
-
56
-
57
-
58
-
59
-
60
-
61
-
62
-
63
-
64
-
65
-
66
-
67
-
68
-
69
-
70
-
71
-
72
-
73
-
74
-
75
-
76
-
77
-
78
-
79
-
80
-
81
-
82
-
83
-
84
-
85
-
86
-
87
-
88
-
89
-
90
-
91
-
92
-
93
-
94
-
95
-
96
-
97
-
98
-
99
-
100
-
101
-
102
-
103
-
104
-
105
-
106
-
107
-
108
-
109
-
110
-
111
-
112
-
113
-
114
-
115
-
116
-
117
-
118
-
119
-
120
-
121
-
122
-
123
-
124
-
125
-
126
-
127
-
128
-
129
-
130
-
131
-
132
-
133
-
134
-
135
-
136
-
137
-
 138
138 -
 139
139 -
 140
140 -
 141
141 -
 142
142 -
 143
143 -
 144
144 -
 145
145 -
 146
146 -
 147
147 -
 148
148 -
 149
149 -
 150
150 -
 151
151 -
 152
152 -
 153
153 -
 154
154 -
 155
155 -
 156
156 -
 157
157 -
 158
158 -
159
-
160
-
161
-
162
-
163
-
164
-
165
-
166
-
167
-
168
-
169
-
170
-
171
-
172
-
173
-
174
-
175
-
176
-
177
-
178
-
179
-
180
-
181
-
182
-
183
-
184
-
185
-
186
-
187
-
188
-
189
-
190
-
191
-
192
-
193
-
194
-
195
-
196
-
197
-
198
-
199
-
200
-
201
-
202
-
203
-
204
-
205
-
206
-
207
-
208
-
209
-
210
-
211
-
212
-
213
-
214
 |
 |

SLM CORPORATION
NOTES TO CONSOLIDATED FINANCIAL STATEMENTS (Continued)
(Dollars in thousands, except per share amounts, unless otherwise stated)
F-26
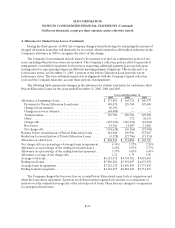
4. Allowance for Student Loan Losses (Continued)
During the third quarter of 2005, the Company changed its methodology for estimating the amount of
charged off student loans that will ultimately be recovered, which resulted in a $49 million reduction in the
Company’s allowance in 2005 to recognize the effect of this change.
The Company’s loss estimates include losses to be incurred over the loss confirmation period of two
years, including when the borrowers are in school. The Company’s collection policies allow for periods of
nonpayment, or modified repayment, for borrowers requesting additional payment grace periods upon
leaving school or experiencing temporary difficulty meeting payment obligations. This is referred to as
forbearance status. At December 31, 2005, 4 percent of the Private Education Loan portfolio was in
forbearance status. The loss confirmation period is in alignment with the Company’s typical collection
cycle and the Company takes into account these periods of nonpayment.
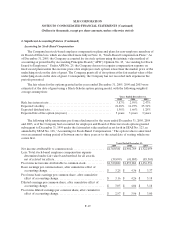
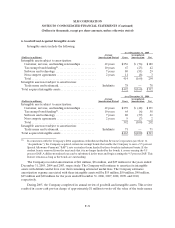
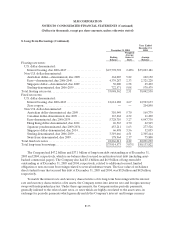
The following table summarizes changes in the allowance for student loan losses for on-balance sheet
Private Education Loans for the years ended December 31, 2005, 2004 and 2003.
Years ended December 31,
2005 2004 2003
Allowance at beginning of year............................. $ 171,886 $ 165,716 $ 180,933
Provision for Private Education Loan losses ............... 185,078 129,768 107,408
Change in loss estimate................................. 40,192 — —
Change in recovery estimate............................. (48,488) — —
Totalprovision......................................... 176,782 129,768 107,408
Other................................................. — 372 20,631
Charge-offs............................................ (153,994) (110,271) (83,001)
Recoveries............................................ 19,366 14,007 11,096
Net charge-offs ........................................ (134,628) (96,264) (71,905)
Balance before securitization of Private Education Loans ..... 214,040 199,592 237,067
Reduction for securitization ofPrivate Education Loans ...... (9,928) (27,706) (71,351)
Allowance at end of year .................................. $ 204,112 $ 171,886 $ 165,716
Net charge-offs as a percentage of average loans in repayment . 4.14% 3.57% 2.59%
Allowance as a percentage of the ending total loan balance .... 2.56% 3.07% 3.57%
Allowance as a percentage of the ending loans in repayment . . . 5.57% 6.05% 6.50%
Allowance coverage of net charge-offs ...................... 1.52 1.79 2.30
Averagetotalloans....................................... $6,921,975 $4,794,782 $5,018,491
Endingtotalloans........................................ $7,960,882 $5,591,497 $4,635,872
Average loans in repayment............................... $3,252,238 $2,696,818 $2,771,815
Endingloansinrepayment ................................ $3,662,255 $2,842,220 $2,551,415
The Company charges the borrower fees on certain Private Education Loans, both at origination and
when the loan enters repayment. Such fees are deferred and recognized into income as a component of
interest over the estimated average life of the related pool of loans. These fees are charged to compensate
for anticipated loan losses.