Sallie Mae 2005 Annual Report Download - page 185
Download and view the complete annual report
Please find page 185 of the 2005 Sallie Mae annual report below. You can navigate through the pages in the report by either clicking on the pages listed below, or by using the keyword search tool below to find specific information within the annual report.-
 1
1 -
2
-
3
-
4
-
5
-
6
-
7
-
8
-
9
-
10
-
11
-
12
-
13
-
14
-
15
-
16
-
17
-
18
-
19
-
20
-
21
-
22
-
23
-
24
-
25
-
26
-
27
-
28
-
29
-
30
-
31
-
32
-
33
-
34
-
35
-
36
-
37
-
38
-
39
-
40
-
41
-
42
-
43
-
44
-
45
-
46
-
47
-
48
-
49
-
50
-
51
-
52
-
53
-
54
-
55
-
56
-
57
-
58
-
59
-
60
-
61
-
62
-
63
-
64
-
65
-
66
-
67
-
68
-
69
-
70
-
71
-
72
-
73
-
74
-
75
-
76
-
77
-
78
-
79
-
80
-
81
-
82
-
83
-
84
-
85
-
86
-
87
-
88
-
89
-
90
-
91
-
92
-
93
-
94
-
95
-
96
-
97
-
98
-
99
-
100
-
101
-
102
-
103
-
104
-
105
-
106
-
107
-
108
-
109
-
110
-
111
-
112
-
113
-
114
-
115
-
116
-
117
-
118
-
119
-
120
-
121
-
122
-
123
-
124
-
125
-
126
-
127
-
128
-
129
-
130
-
131
-
132
-
133
-
134
-
135
-
136
-
137
-
138
-
139
-
140
-
141
-
142
-
143
-
144
-
145
-
146
-
147
-
148
-
149
-
150
-
151
-
152
-
153
-
154
-
155
-
156
-
157
-
158
-
159
-
160
-
161
-
162
-
163
-
164
-
165
-
166
-
167
-
168
-
169
-
170
-
171
-
172
-
173
-
174
-
 175
175 -
 176
176 -
 177
177 -
 178
178 -
 179
179 -
 180
180 -
 181
181 -
 182
182 -
 183
183 -
 184
184 -
 185
185 -
 186
186 -
 187
187 -
 188
188 -
 189
189 -
 190
190 -
 191
191 -
 192
192 -
 193
193 -
 194
194 -
 195
195 -
196
-
197
-
198
-
199
-
200
-
201
-
202
-
203
-
204
-
205
-
206
-
207
-
208
-
209
-
210
-
211
-
212
-
213
-
214
 |
 |

SLM CORPORATION
NOTES TO CONSOLIDATED FINANCIAL STATEMENTS (Continued)
(Dollars in thousands, except per share amounts, unless otherwise stated)
F-63
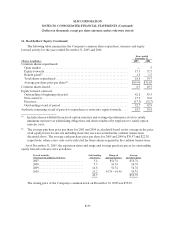
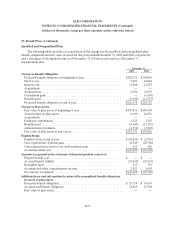
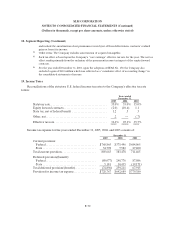
17. Benefit Plans (Continued)
Qualified and Nonqualified Plans
The following tables provide a reconciliation of the changes in the qualified and nonqualified plan
benefit obligations and fair value of assets for the years ended December 31, 2005 and 2004, respectively,
and a statement of the funded status as of December 31 of both years based on a December 31
measurement date.
December 31,
2005 2004
Change in Benefit Obligation
Projected benefit obligation at beginningof year.......................... $202,352 $184,019
Service cost........................................................... 9,893 10,862
Interestcost.......................................................... 11,208 11,237
Acquisitions.......................................................... — —
Actuarial loss......................................................... 2,380 14,279
Curtailment gain...................................................... — (6,310)
Benefits paid ......................................................... (9,695) (11,735)
Projected benefit obligation at end of year................................ $216,138 $202,352
Change in Plan Assets
Fairvalue ofplan assets atbeginning of year.............................. $199,816 $184,495
Actual returnon plan assets............................................ 8,160 26,856
Acquisitions.......................................................... — —
Employercontribution................................................. 1,225 1,745
Benefits paid ......................................................... (9,695) (11,735)
Administrative payments............................................... (1,534) (1,545)
Fairvalue ofplan assets atend of year................................... $197,972 $199,816
Funded Status
Funded status at end of year............................................ $(18,166) $ (2,536)
Unrecognized net actuarialgain......................................... (8,349) (20,780)
Unrecognized priorservicecost and transition asset....................... 112 186
Accrued pension cost.................................................. $(26,403) $(23,130)
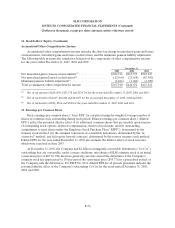
Amounts recognized in the statement of financial position consist of:
Prepaid benefit cost ................................................... $ — $ —
Accrued benefit liability................................................ (29,447) (25,091)
Intangibleasset....................................................... 213 356
Accumulated other comprehensive income ............................... 2,831 1,605
Net amount recognized ................................................ $(26,403) $(23,130)
Additional year-end information for plans with accumulated benefit obligations
in excess of plan assets:
Projected benefit obligation ............................................ $ 25,716 $ 19,643
Accumulated benefit obligation ......................................... 21,869 19,500
Fair valueof planassets................................................ — —