Sallie Mae 2005 Annual Report Download - page 67
Download and view the complete annual report
Please find page 67 of the 2005 Sallie Mae annual report below. You can navigate through the pages in the report by either clicking on the pages listed below, or by using the keyword search tool below to find specific information within the annual report.-
 1
1 -
2
-
3
-
4
-
5
-
6
-
7
-
8
-
9
-
10
-
11
-
12
-
13
-
14
-
15
-
16
-
17
-
18
-
19
-
20
-
21
-
22
-
23
-
24
-
25
-
26
-
27
-
28
-
29
-
30
-
31
-
32
-
33
-
34
-
35
-
36
-
37
-
38
-
39
-
40
-
41
-
42
-
43
-
44
-
45
-
46
-
47
-
48
-
49
-
50
-
51
-
52
-
53
-
54
-
55
-
56
-
 57
57 -
 58
58 -
 59
59 -
 60
60 -
 61
61 -
 62
62 -
 63
63 -
 64
64 -
 65
65 -
 66
66 -
 67
67 -
 68
68 -
 69
69 -
 70
70 -
 71
71 -
 72
72 -
 73
73 -
 74
74 -
 75
75 -
 76
76 -
 77
77 -
78
-
79
-
80
-
81
-
82
-
83
-
84
-
85
-
86
-
87
-
88
-
89
-
90
-
91
-
92
-
93
-
94
-
95
-
96
-
97
-
98
-
99
-
100
-
101
-
102
-
103
-
104
-
105
-
106
-
107
-
108
-
109
-
110
-
111
-
112
-
113
-
114
-
115
-
116
-
117
-
118
-
119
-
120
-
121
-
122
-
123
-
124
-
125
-
126
-
127
-
128
-
129
-
130
-
131
-
132
-
133
-
134
-
135
-
136
-
137
-
138
-
139
-
140
-
141
-
142
-
143
-
144
-
145
-
146
-
147
-
148
-
149
-
150
-
151
-
152
-
153
-
154
-
155
-
156
-
157
-
158
-
159
-
160
-
161
-
162
-
163
-
164
-
165
-
166
-
167
-
168
-
169
-
170
-
171
-
172
-
173
-
174
-
175
-
176
-
177
-
178
-
179
-
180
-
181
-
182
-
183
-
184
-
185
-
186
-
187
-
188
-
189
-
190
-
191
-
192
-
193
-
194
-
195
-
196
-
197
-
198
-
199
-
200
-
201
-
202
-
203
-
204
-
205
-
206
-
207
-
208
-
209
-
210
-
211
-
212
-
213
-
214
 |
 |

57
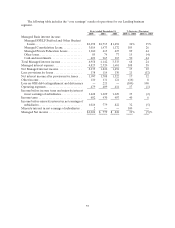
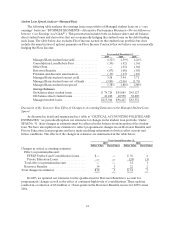
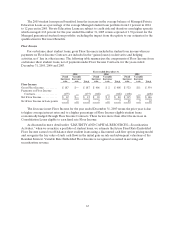
The following table includes the “core earnings” results of operations for our Lending business
segment.
Years ended December 31, % Increase (Decrease)
2005 2004 2003 2005 vs. 2004 2004 vs. 2003
Managed Basis interest income:
Managed FFELP Stafford and Other Student
Loans.................................. $2,298 $1,715 $1,494 34% 15%
ManagedConsolidationLoans.............. 3,014 1,473 1,172 105 26
Managed Private Education Loans.......... 1,160 613 427 89 44
Otherloans............................... 85 74 77 15 (4)
Cashandinvestments...................... 401 267 163 50 64
Total Managed interest income............... 6,958 4,142 3,333 68 24
Managedinterestexpense.................... 4,823 2,320 1,681 108 38
Net Managed interest income................. 2,135 1,822 1,652 17 10
Less:provisionsforlosses .................... 138 114 130 21 (12)
Net interest income after provisions for losses . . 1,997 1,708 1,522 17 12
Otherincome............................... 110 131 121 (16) 8
Loss on GSE debt extinguishment and defeasance — 221 — (100 ) 100
Operatingexpenses.......................... 479 409 414 17 (1)
Income before income taxes and minority interest
innet earnings of subsidiaries............... 1,628 1,209 1,229 35 (2)
Incometaxes ............................... 602 430 407 40 6
Income before minority interest in net earnings of
subsidiaries............................... 1,026 779 822 32 (5)
Minority interest in net earnings of subsidiaries . 2 — — 100 —
ManagedNetincome........................ $1,024 $ 779 $ 822 31% (5)%