Sallie Mae 2005 Annual Report Download - page 167
Download and view the complete annual report
Please find page 167 of the 2005 Sallie Mae annual report below. You can navigate through the pages in the report by either clicking on the pages listed below, or by using the keyword search tool below to find specific information within the annual report.-
 1
1 -
2
-
3
-
4
-
5
-
6
-
7
-
8
-
9
-
10
-
11
-
12
-
13
-
14
-
15
-
16
-
17
-
18
-
19
-
20
-
21
-
22
-
23
-
24
-
25
-
26
-
27
-
28
-
29
-
30
-
31
-
32
-
33
-
34
-
35
-
36
-
37
-
38
-
39
-
40
-
41
-
42
-
43
-
44
-
45
-
46
-
47
-
48
-
49
-
50
-
51
-
52
-
53
-
54
-
55
-
56
-
57
-
58
-
59
-
60
-
61
-
62
-
63
-
64
-
65
-
66
-
67
-
68
-
69
-
70
-
71
-
72
-
73
-
74
-
75
-
76
-
77
-
78
-
79
-
80
-
81
-
82
-
83
-
84
-
85
-
86
-
87
-
88
-
89
-
90
-
91
-
92
-
93
-
94
-
95
-
96
-
97
-
98
-
99
-
100
-
101
-
102
-
103
-
104
-
105
-
106
-
107
-
108
-
109
-
110
-
111
-
112
-
113
-
114
-
115
-
116
-
117
-
118
-
119
-
120
-
121
-
122
-
123
-
124
-
125
-
126
-
127
-
128
-
129
-
130
-
131
-
132
-
133
-
134
-
135
-
136
-
137
-
138
-
139
-
140
-
141
-
142
-
143
-
144
-
145
-
146
-
147
-
148
-
149
-
150
-
151
-
152
-
153
-
154
-
155
-
156
-
 157
157 -
 158
158 -
 159
159 -
 160
160 -
 161
161 -
 162
162 -
 163
163 -
 164
164 -
 165
165 -
 166
166 -
 167
167 -
 168
168 -
 169
169 -
 170
170 -
 171
171 -
 172
172 -
 173
173 -
 174
174 -
 175
175 -
 176
176 -
 177
177 -
178
-
179
-
180
-
181
-
182
-
183
-
184
-
185
-
186
-
187
-
188
-
189
-
190
-
191
-
192
-
193
-
194
-
195
-
196
-
197
-
198
-
199
-
200
-
201
-
202
-
203
-
204
-
205
-
206
-
207
-
208
-
209
-
210
-
211
-
212
-
213
-
214
 |
 |

SLM CORPORATION
NOTES TO CONSOLIDATED FINANCIAL STATEMENTS (Continued)
(Dollars in thousands, except per share amounts, unless otherwise stated)
F-45
10. Derivative Financial Instruments (Continued)
usually possess a term of up to ten years with a pay rate indexed to 91-day Treasury bill, 3-month
commercial paper, 52-week Treasury bill, LIBOR, Prime, or 1-year constant maturity Treasury rates. The
specific terms and notional amounts of the swaps are determined based on management’s review of its
asset/liability structure, its assessment of future interest rate relationships, and on other factors such as
short-term strategic initiatives. These swaps typically do not qualify as hedges and are accounted for as
trading.
In addition, the Company enters into equity forward contracts. These contracts are viewed as
economic hedges but do no qualify as hedges under SFAS No. 133. (See Note 14, “Stockholders’ Equity,”
for a further discussion of equity forward contracts.) The Company utilizes the strategy to minimize
exposure to fluctuations in the Company’s stock price and to better manage the cost of its share
repurchases. The Company’s equity forward contracts provide for physical, net share or net cash
settlement options. In addition, the Company may be required to unwind portions or all of a contract if the
price of the Company’s common stock falls below a certain percentage of the strike price (usually between
50 percent to 65 percent) or if the Company’s credit rating falls below a pre-determined level.
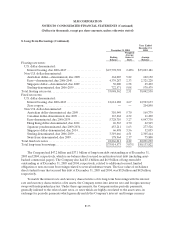
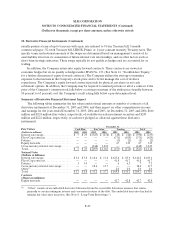
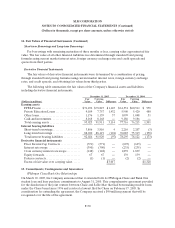
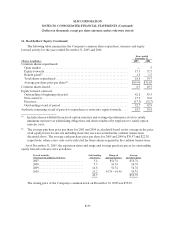
Summary of Derivative Financial Statement Impact
The following tables summarize the fair values and notional amounts or number of contracts of all
derivative instruments at December 31, 2005 and 2004, and their impact on other comprehensive income
and earnings for the years ended December 31, 2005, 2004 and 2003. At December 31, 2005 and 2004, $666
million and $524 million (fair value), respectively, of available-for-sale investment securities and $249
million and $222 million, respectively, of cash were pledged as collateral against these derivative
instruments.
December 31,
Fair Values Cash Flow Fair Value Trading Total
(Dollars in millions) 2005 2004 2005 2004 2005 2004 2005 2004
Interestrateswaps.................... $ 5 $ 25 $(347) $ (176) $ (48) $ (84 ) $ (390 ) $ (235)
Floor/Cap contracts ................... — — — — (371) (625 ) (371 ) (625)
Futures.............................. — — — — (1) (2) (1) (2)
Equityforwards....................... — — — — 67 139 67 139
Cross currency interest rateswaps....... — — (148) 1,839 — — (148 ) 1,839
Total................................ $ 5 $ 25 $(495) $ 1,663 $ (353) $ (572 ) $ (843 ) $ 1,116
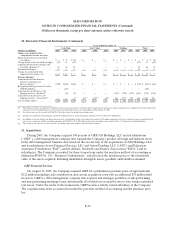
Notional Value
(Dollars in billions)
Interestrateswaps.................... $1.2 $5.8 $ 14.6 $ 13.4 $125.4 $ 85.9 $ 141.2 $ 105.1
Floor/Capcontracts................... — — — — 41.8 41.7 41.8 41.7
Futures.............................. .1 1.0 — — .6 6.5 .7 7.5
Cross currency interest rateswaps....... — — 18.6 13.7 — — 18.6 13.7
Other(1) .............................. — — — — 2.0 2.0 2.0 2.0
Total................................ $1.3 $6.8 $33.2 $ 27.1 $169.8 $ 136.1 $ 204.3 $ 170.0
Contracts
(Shares in millions)
Equityforwards....................... — — — — 42.7 42.8 42.7 42.8
(1) “Other” consists of an embedded derivative bifurcated from the convertible debenture issuance that relates
primarily to certain contingent interest and conversion features of the debt. The embedded derivative has had de
minimis fair value since inception. (See Note 8, “Long-Term Borrowings.”)